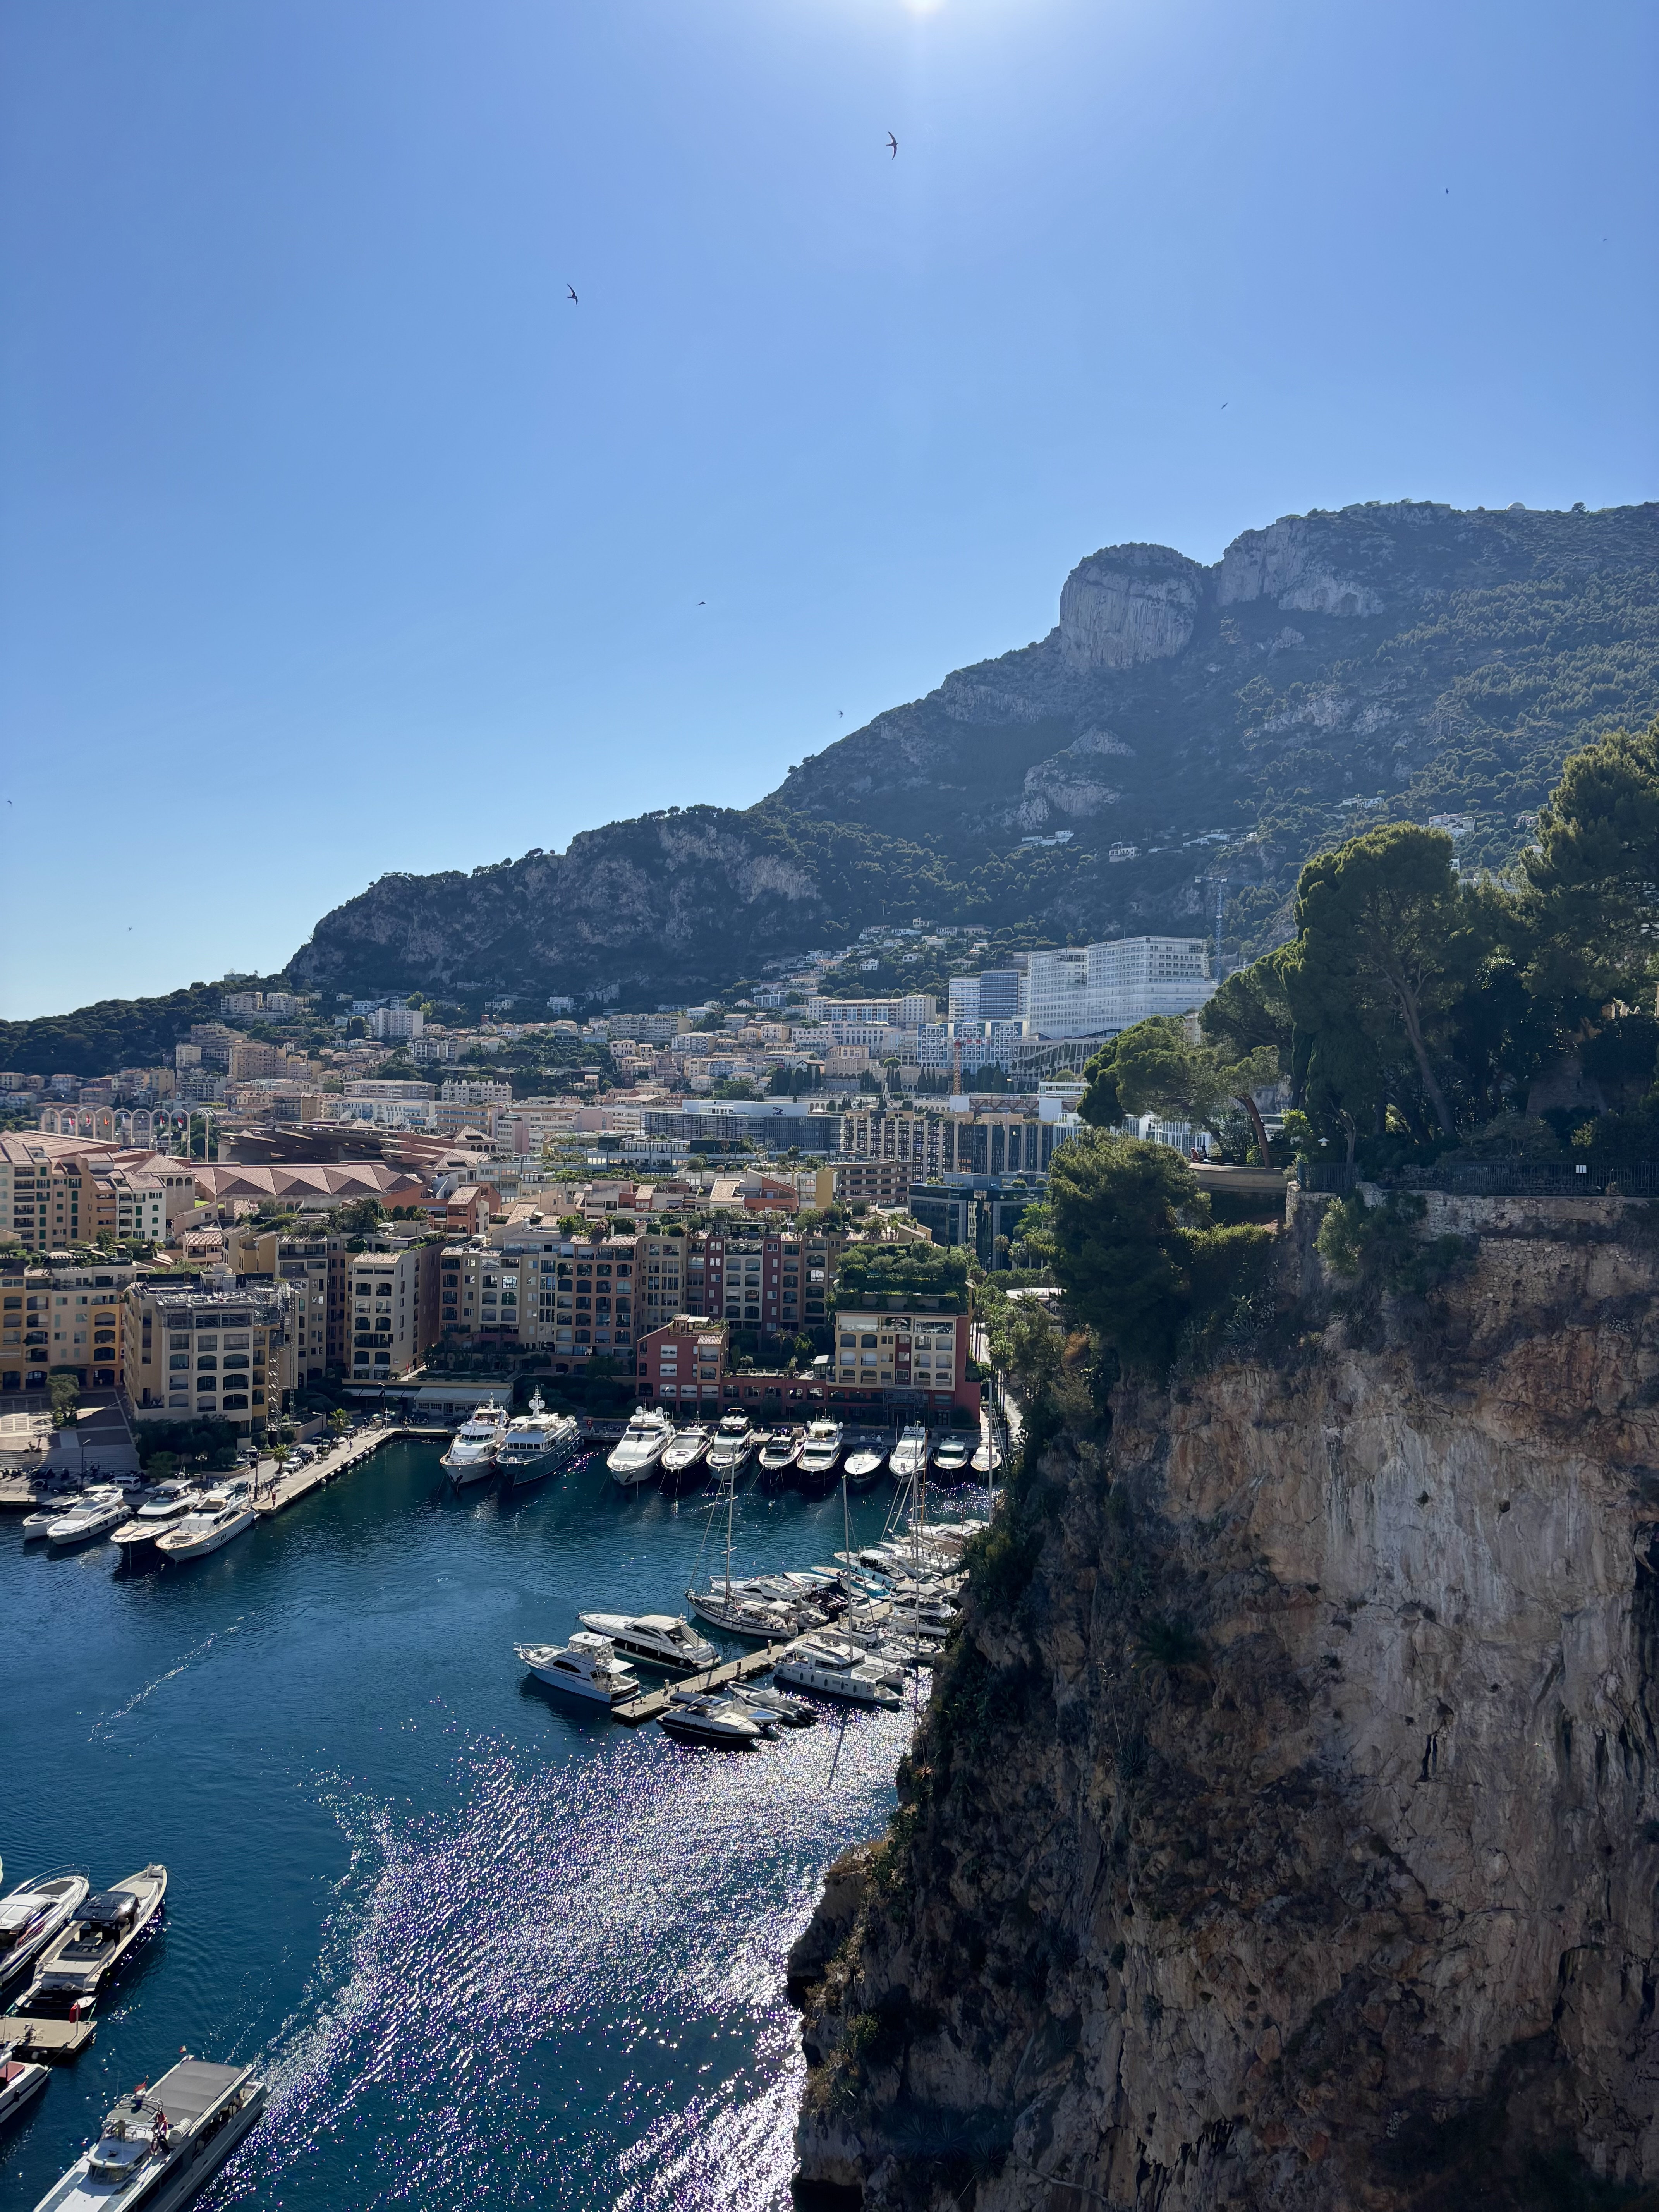
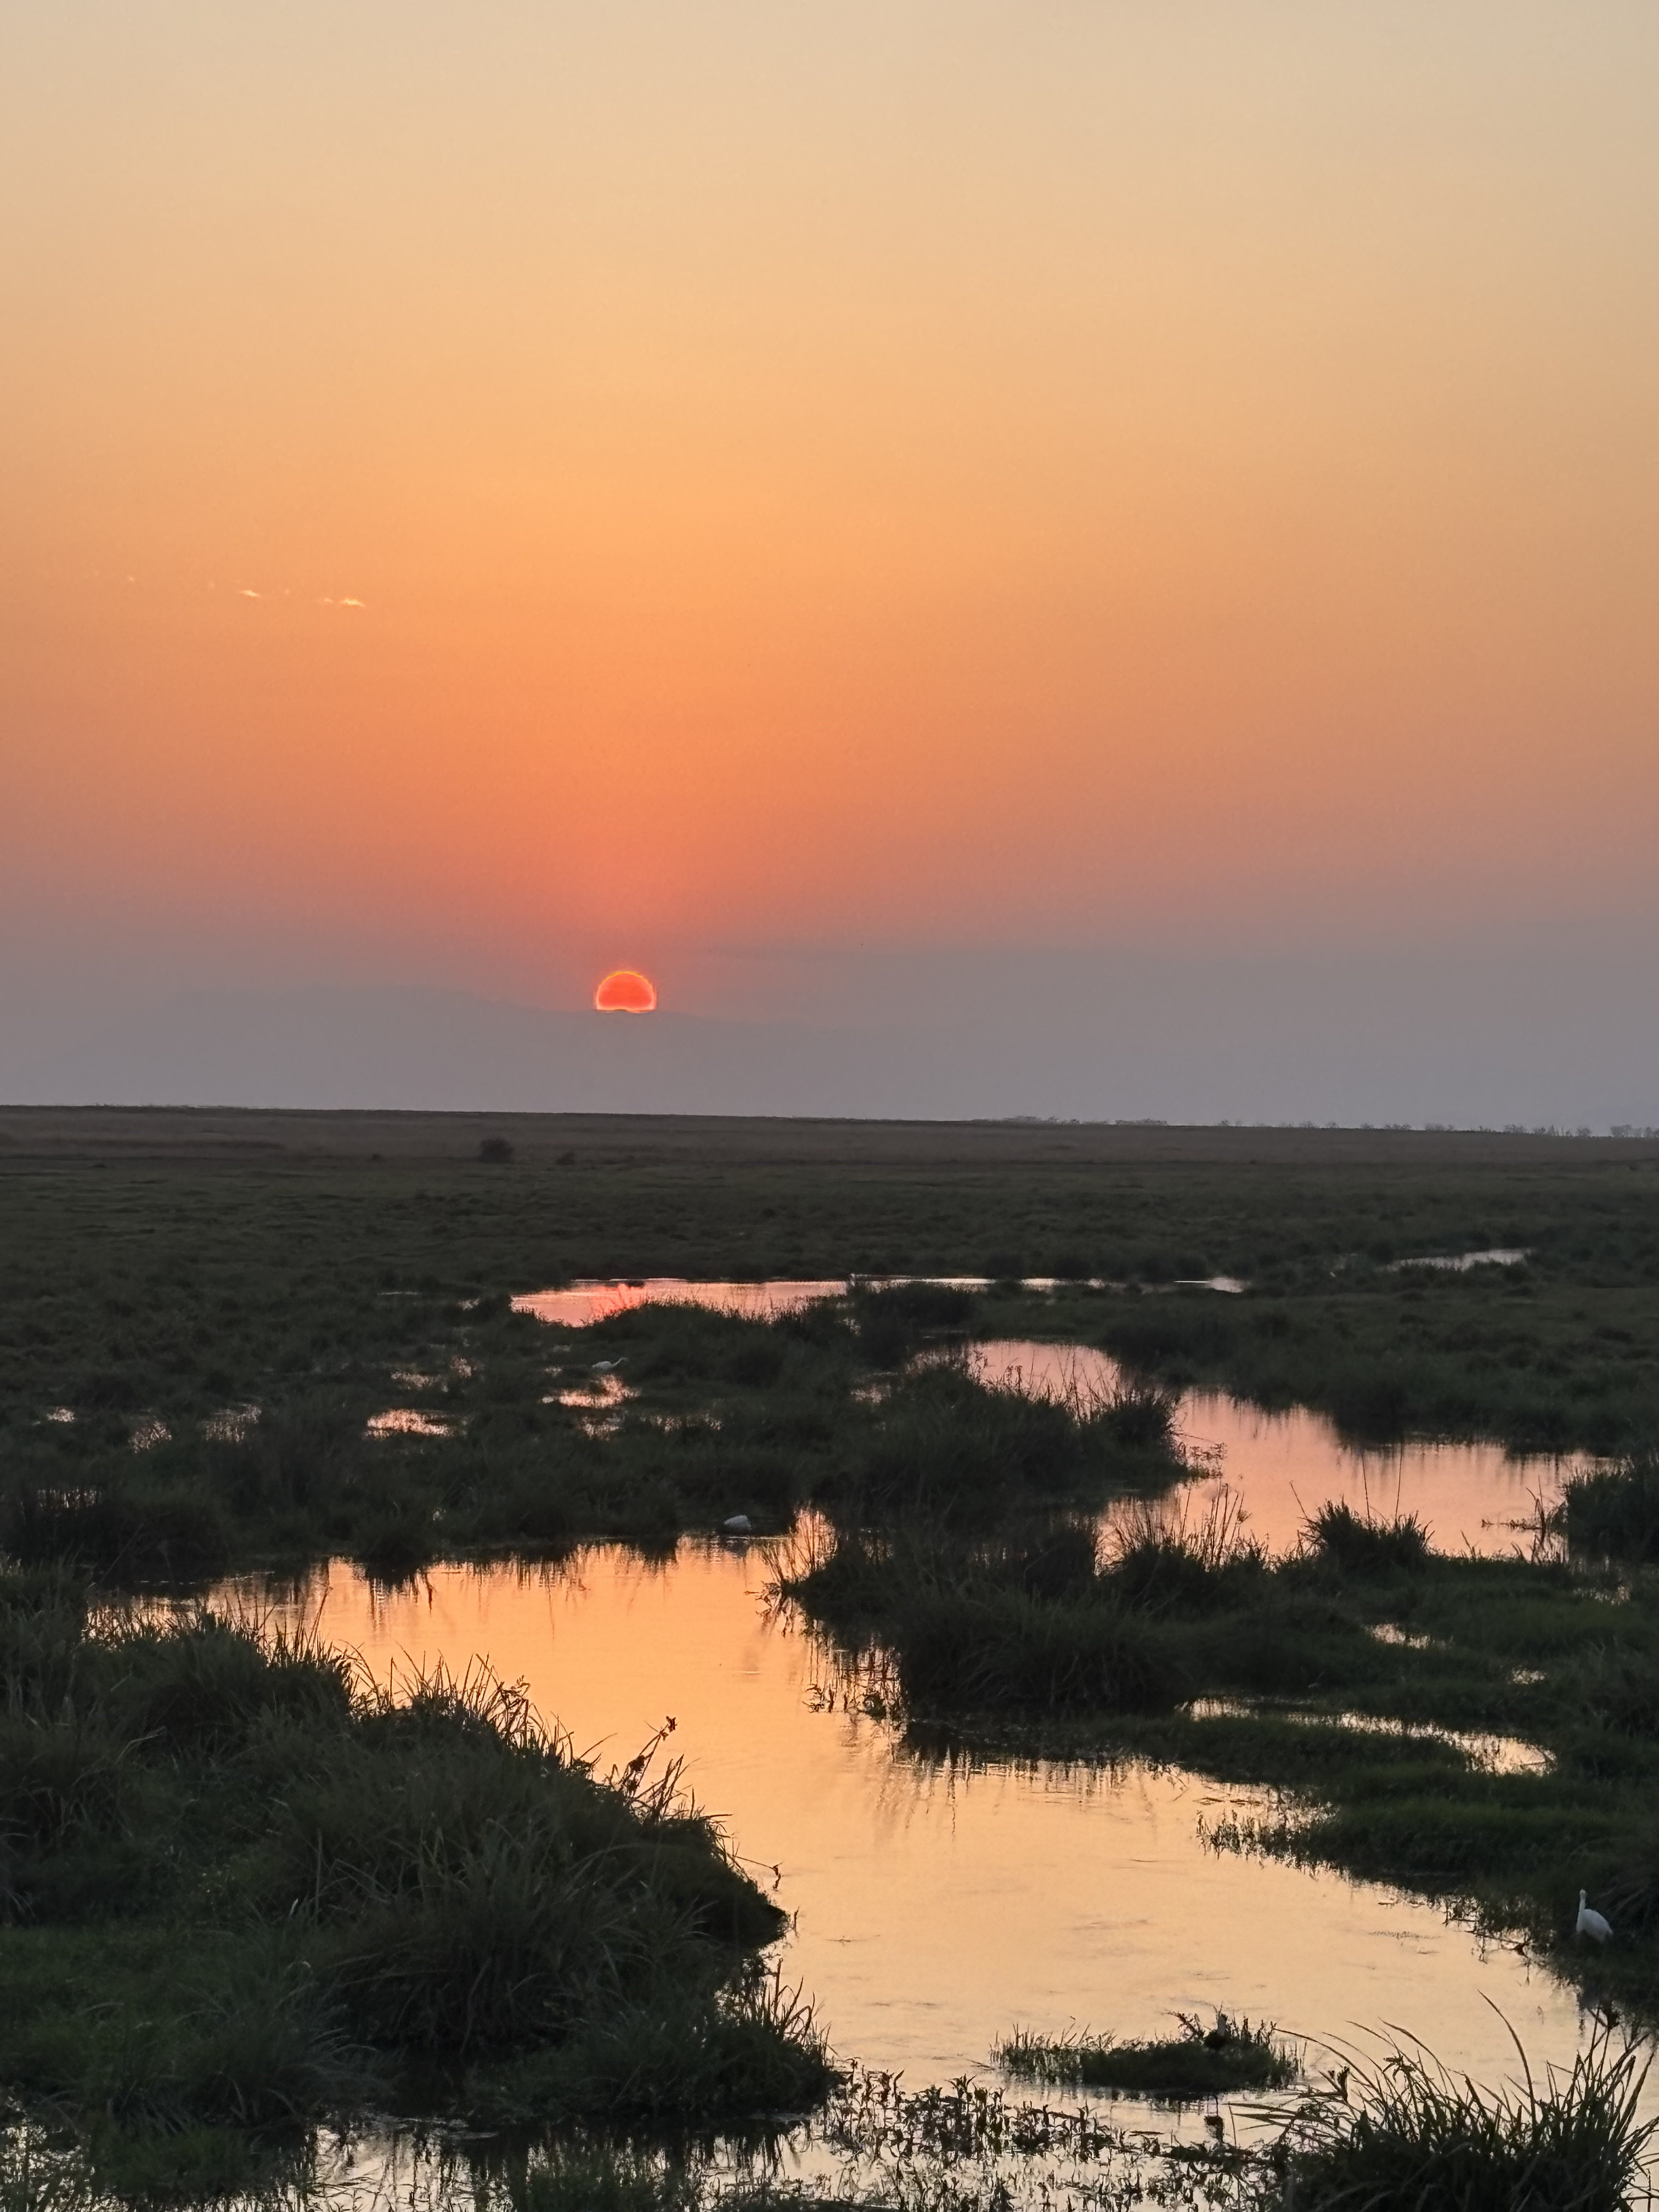
S. Menchaca

41.8781° N, 87.6298° W — based in Chicago, working from anywhere

Hi, I'm Sophia Menchaca.

Data Scientist and Master of Applied Data Science candidate at the University of Michigan, with a math teacher's instinct for making complicated concepts click. I build with Python, SQL, and streamlit, and spend my off hours mapping everywhere I've traveled.
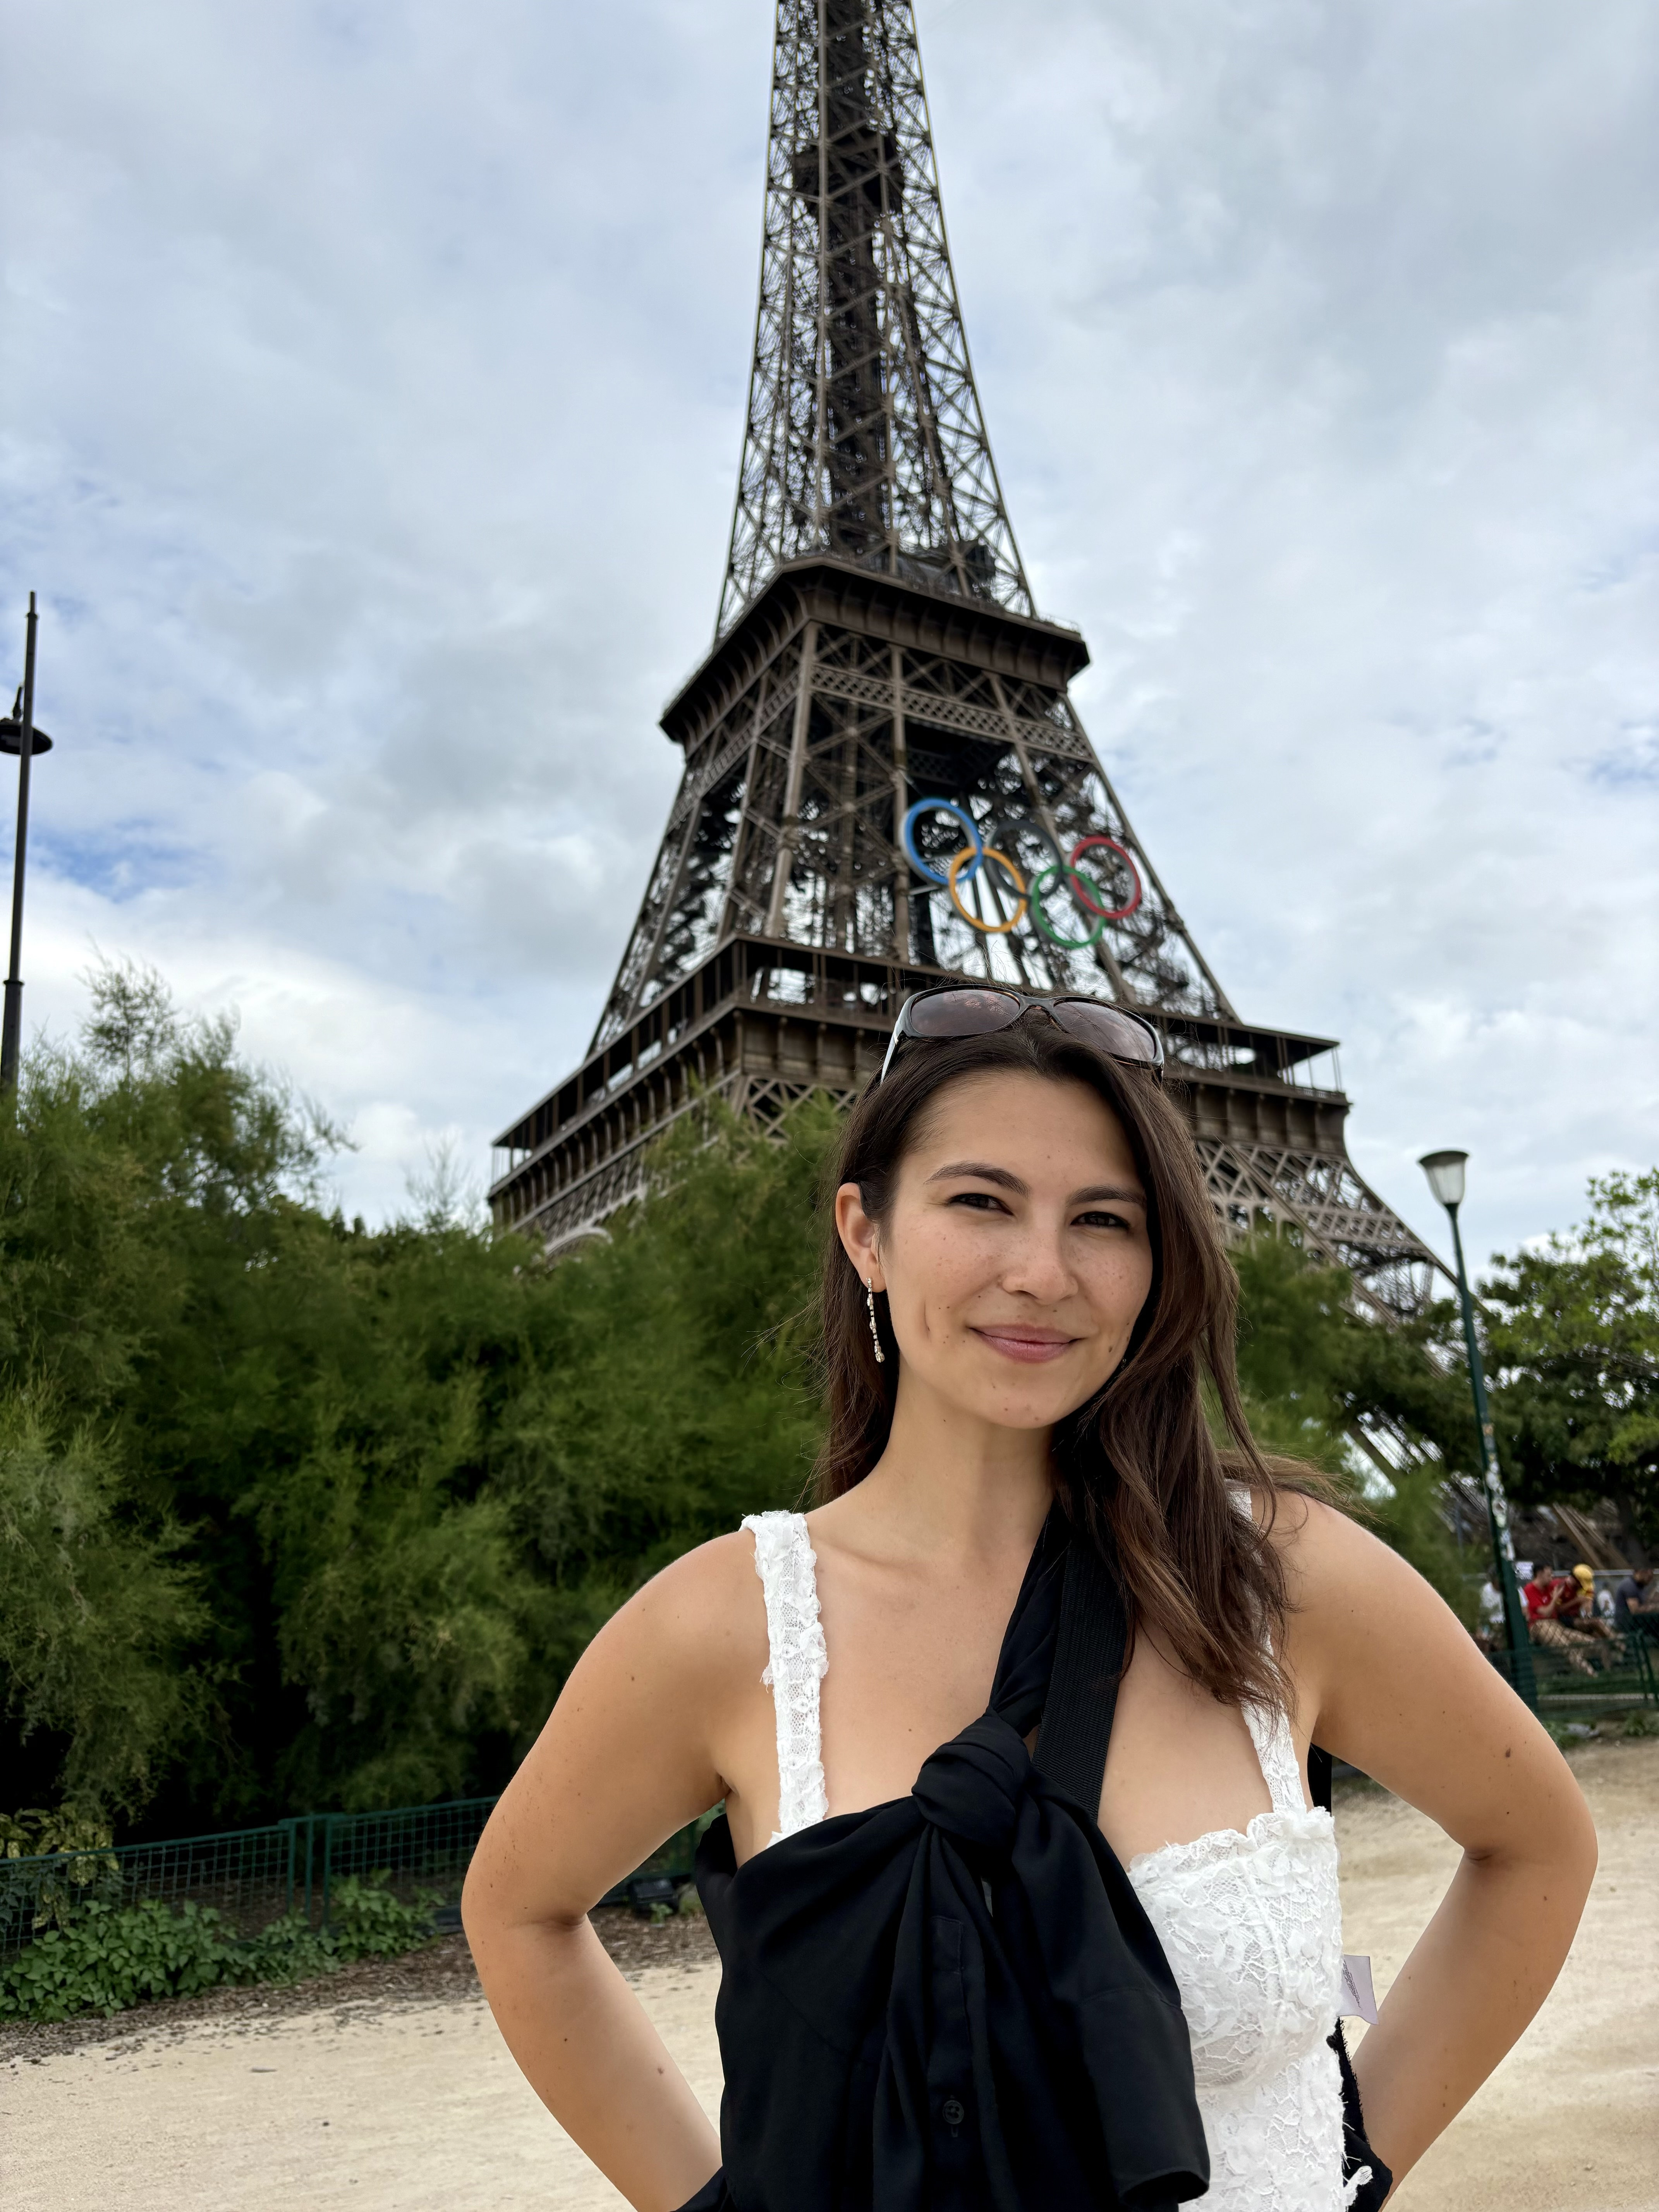
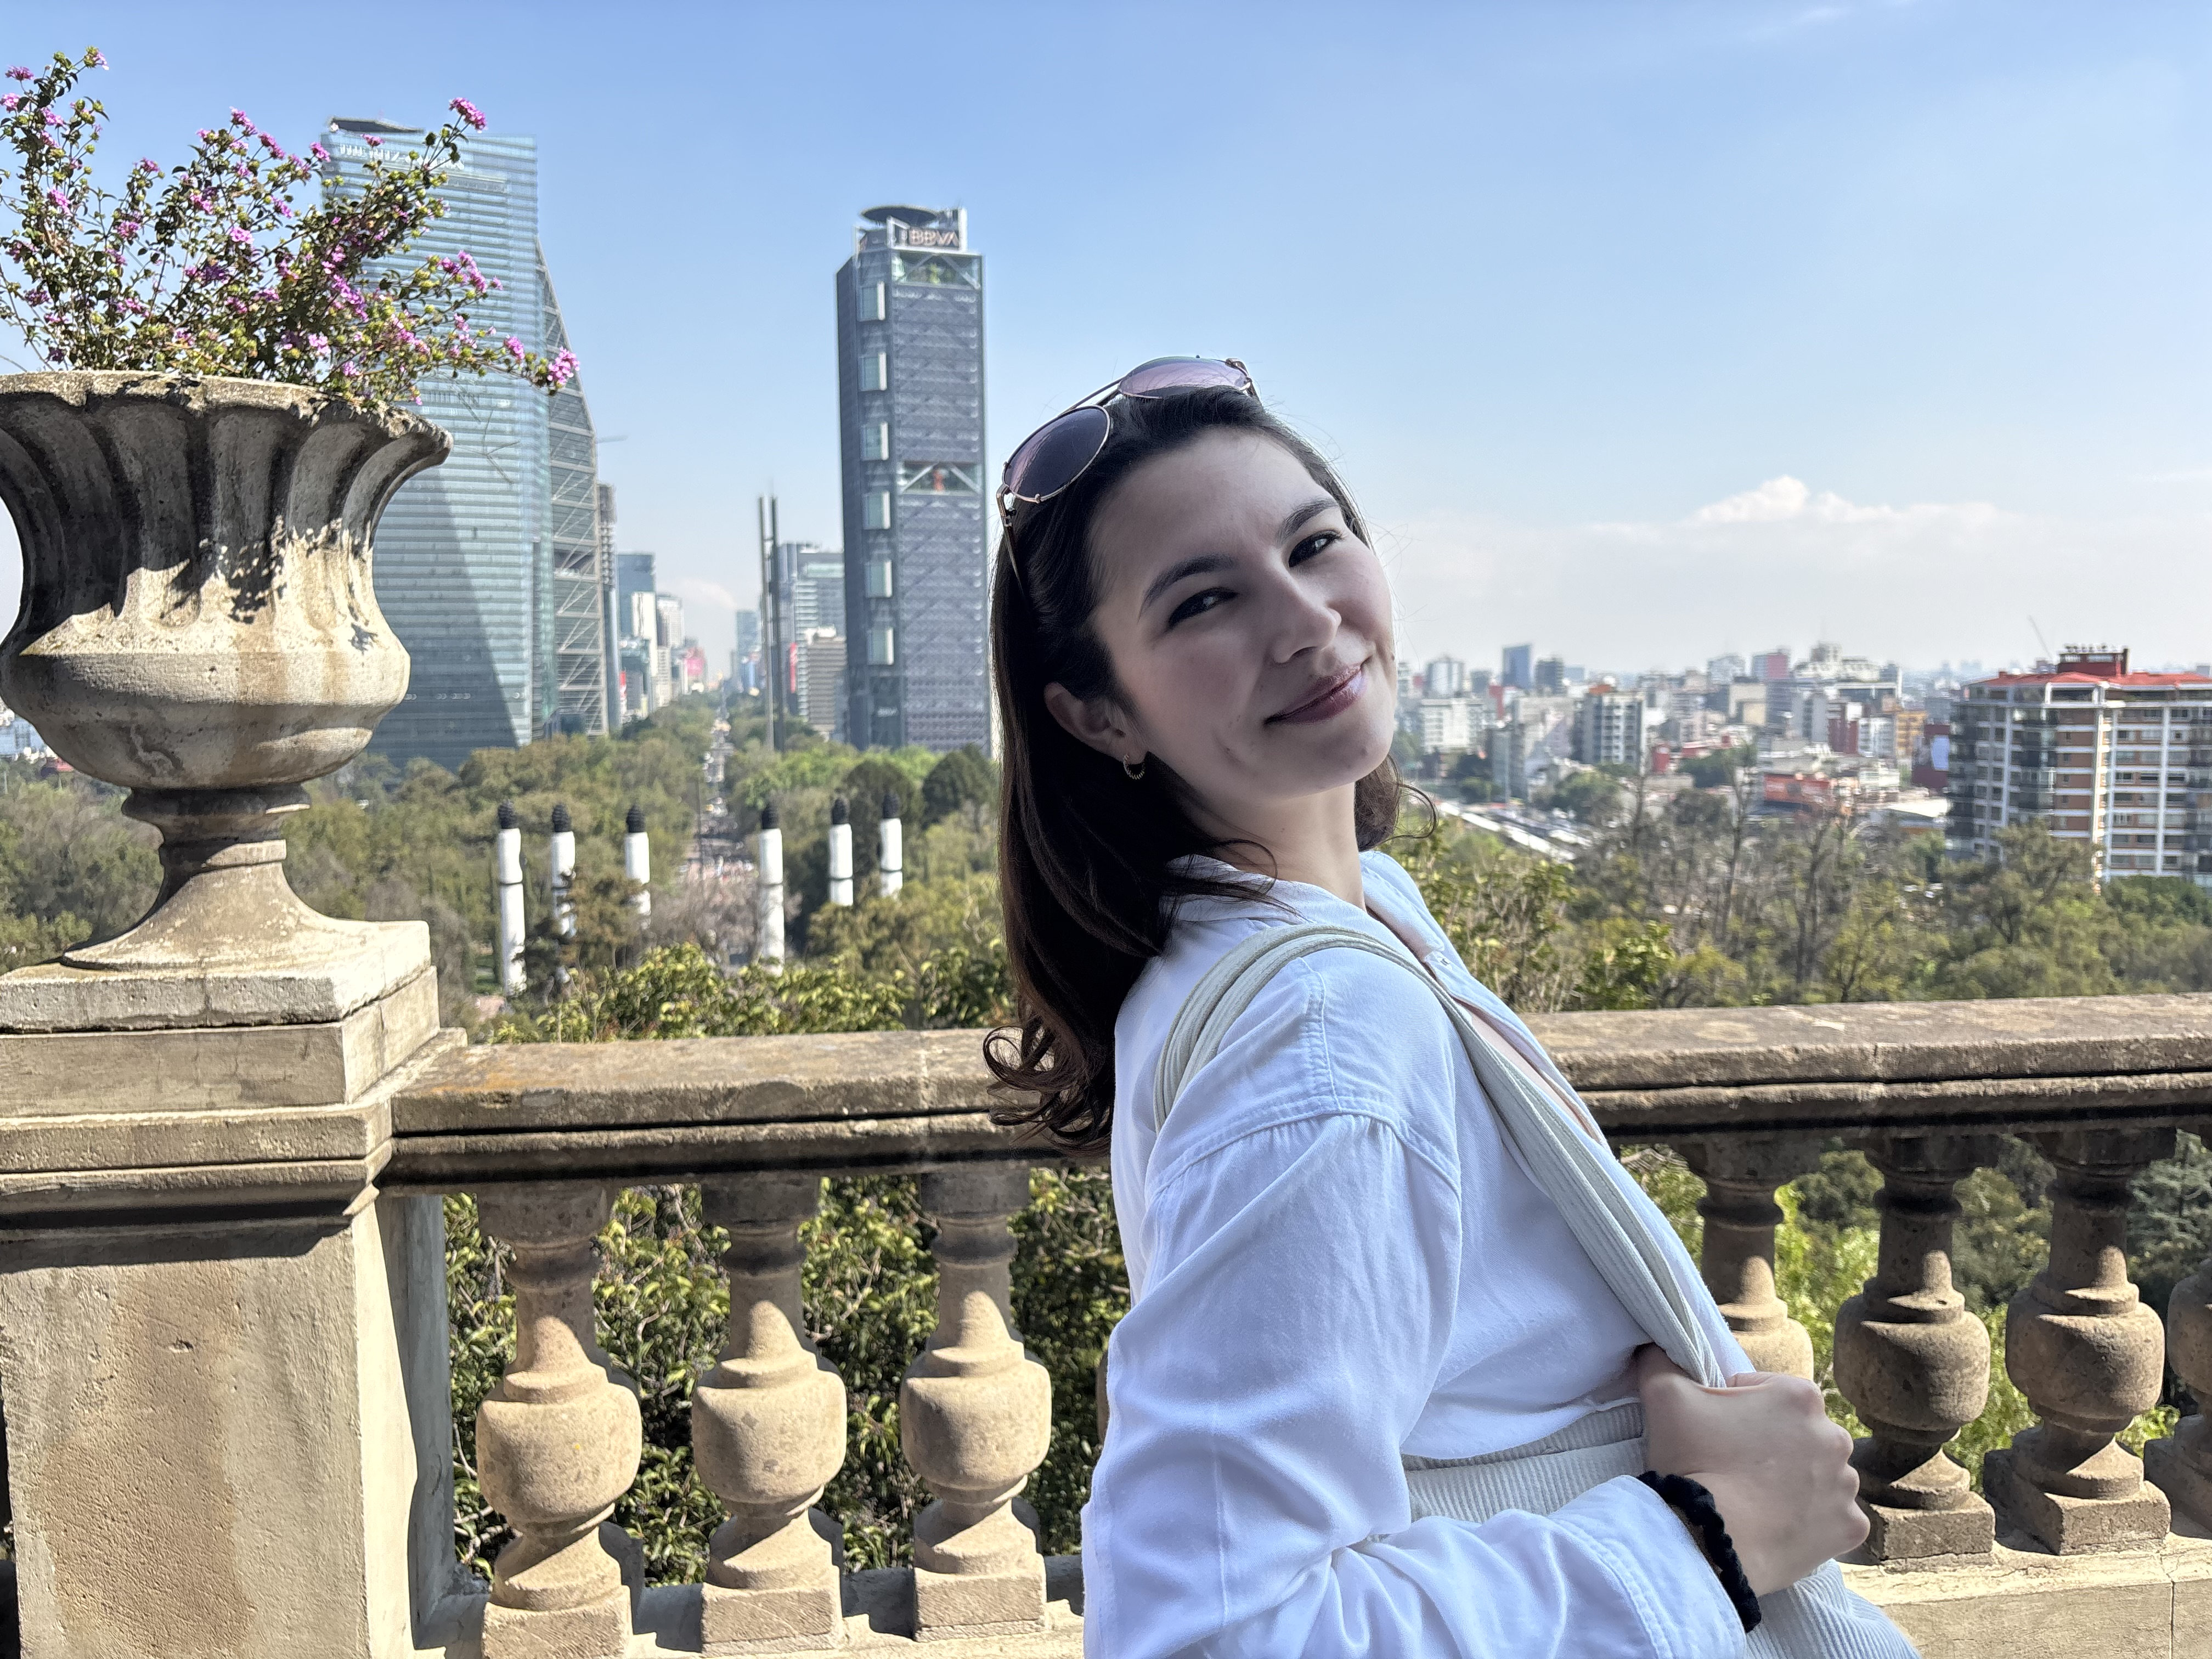
Paris Profile
Paris

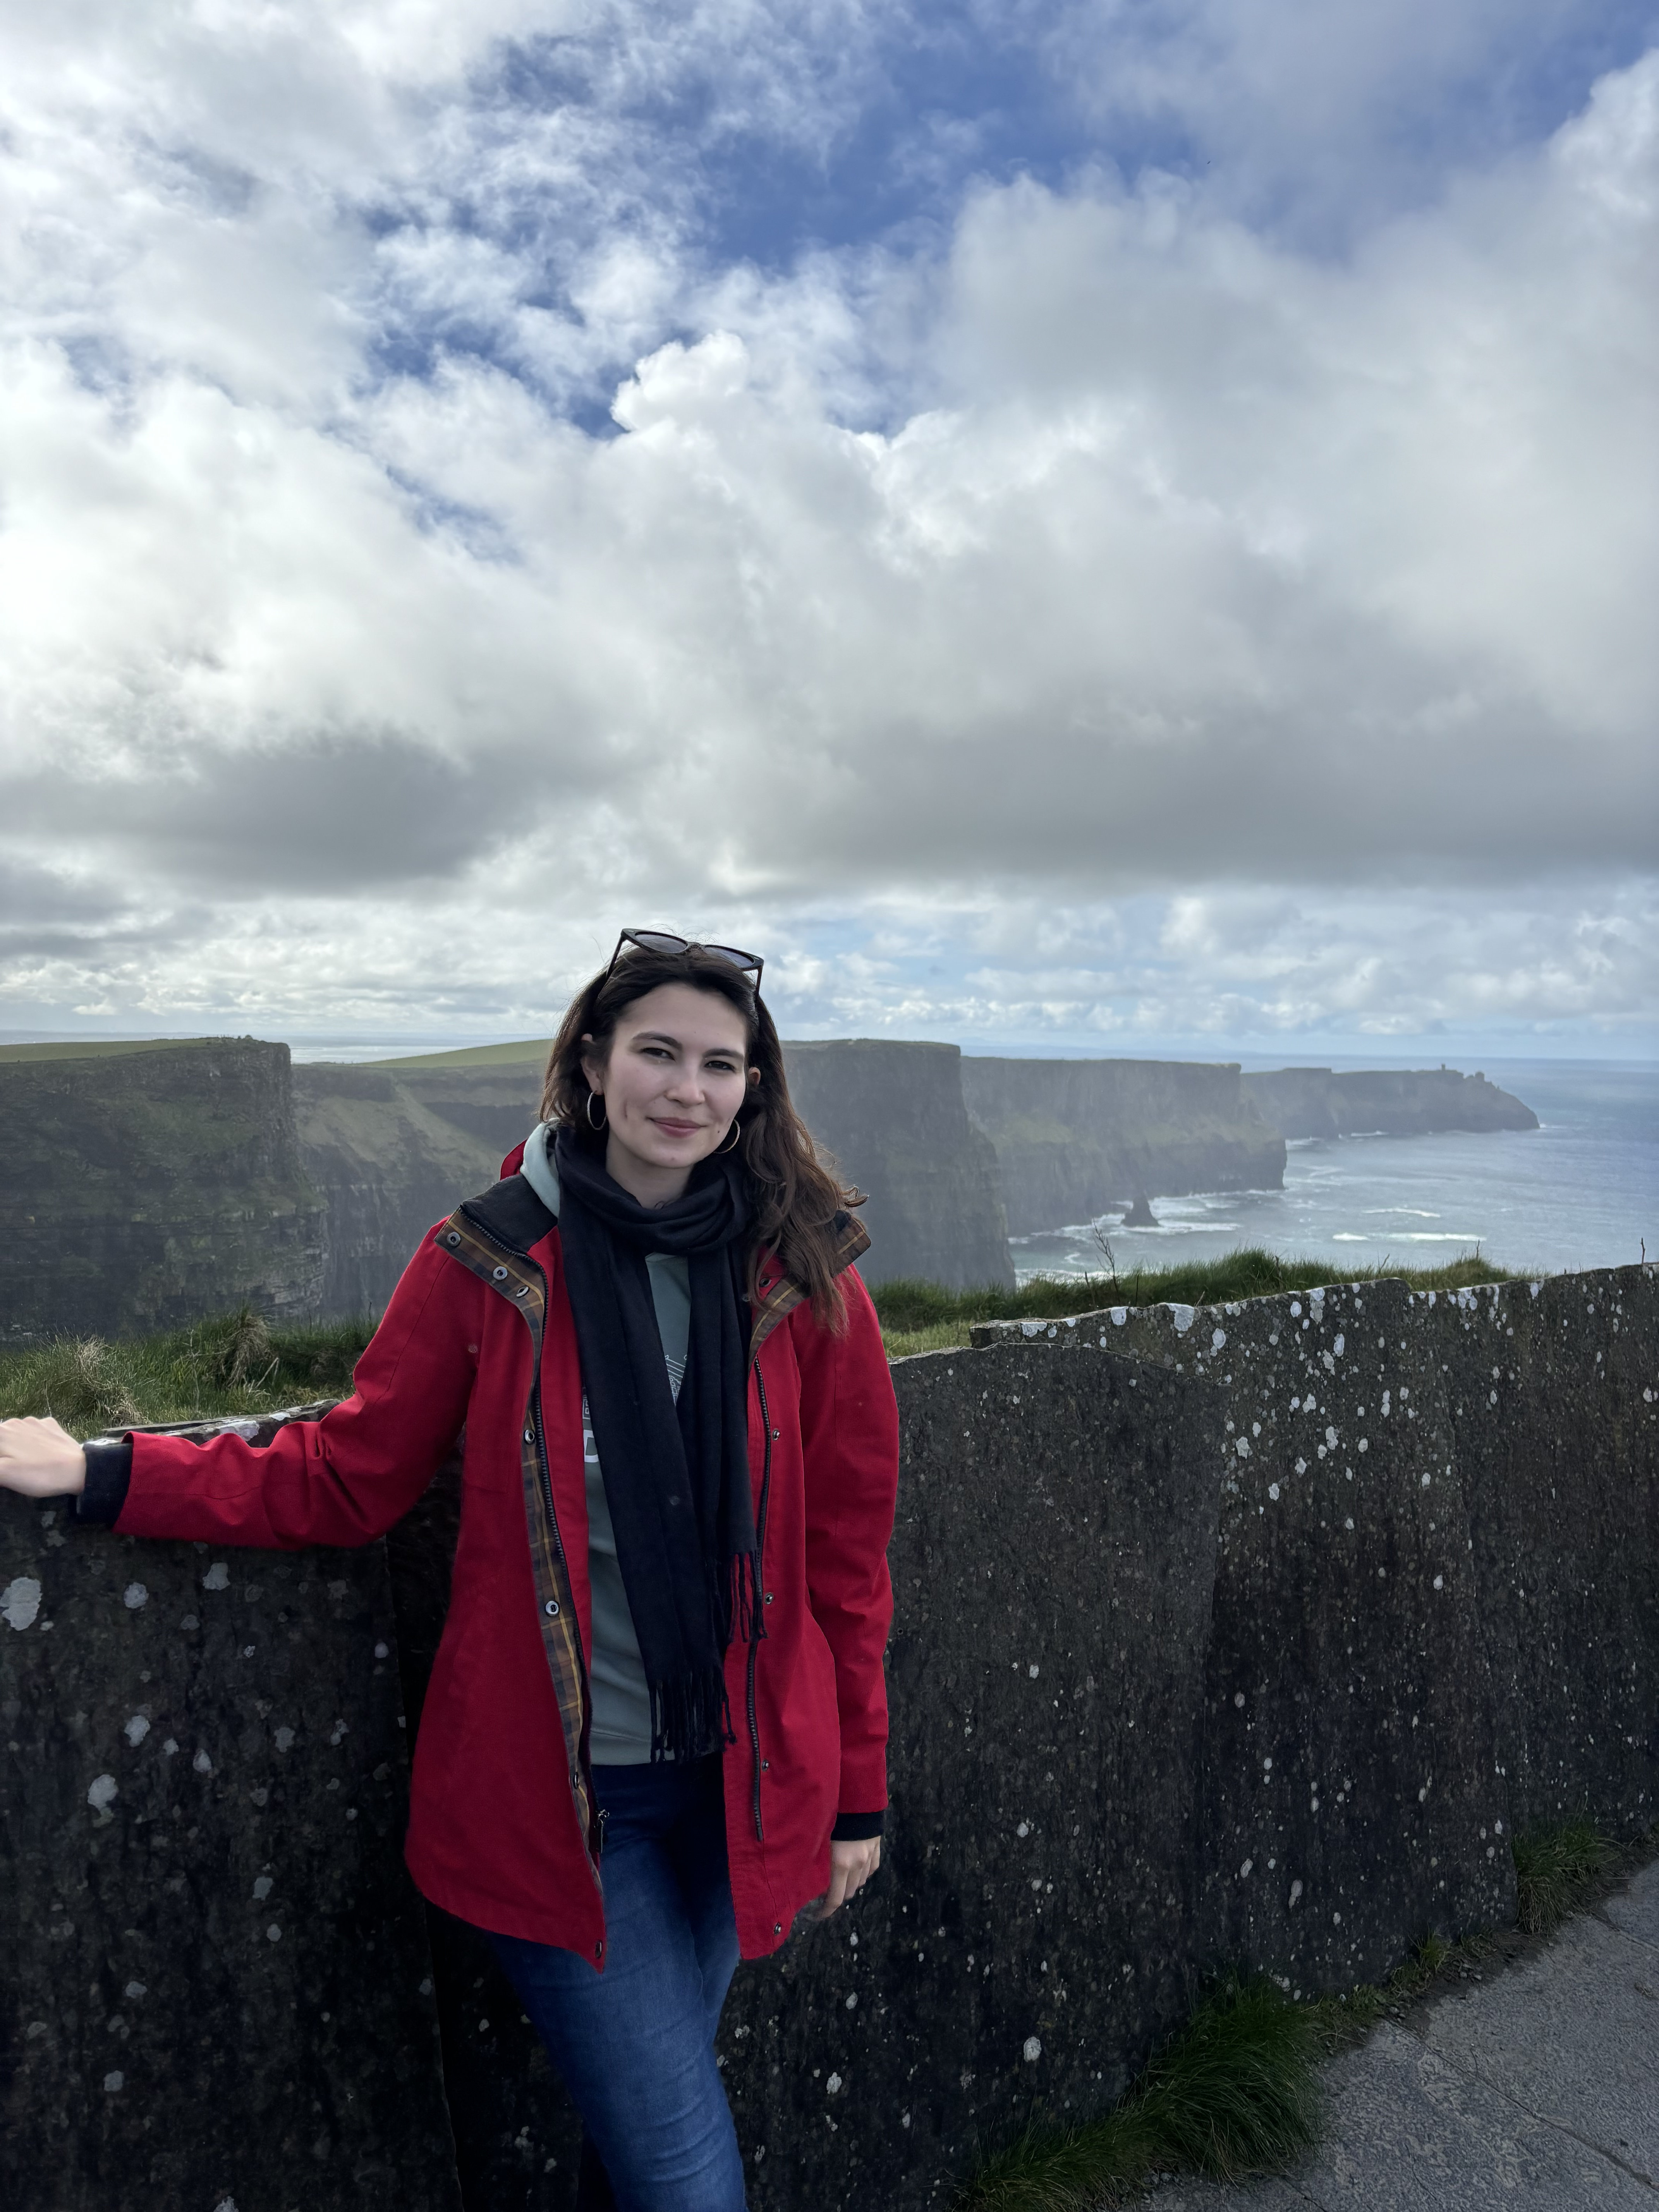
Ireland Profile

Ireland

Mexico Profile

Mexico City

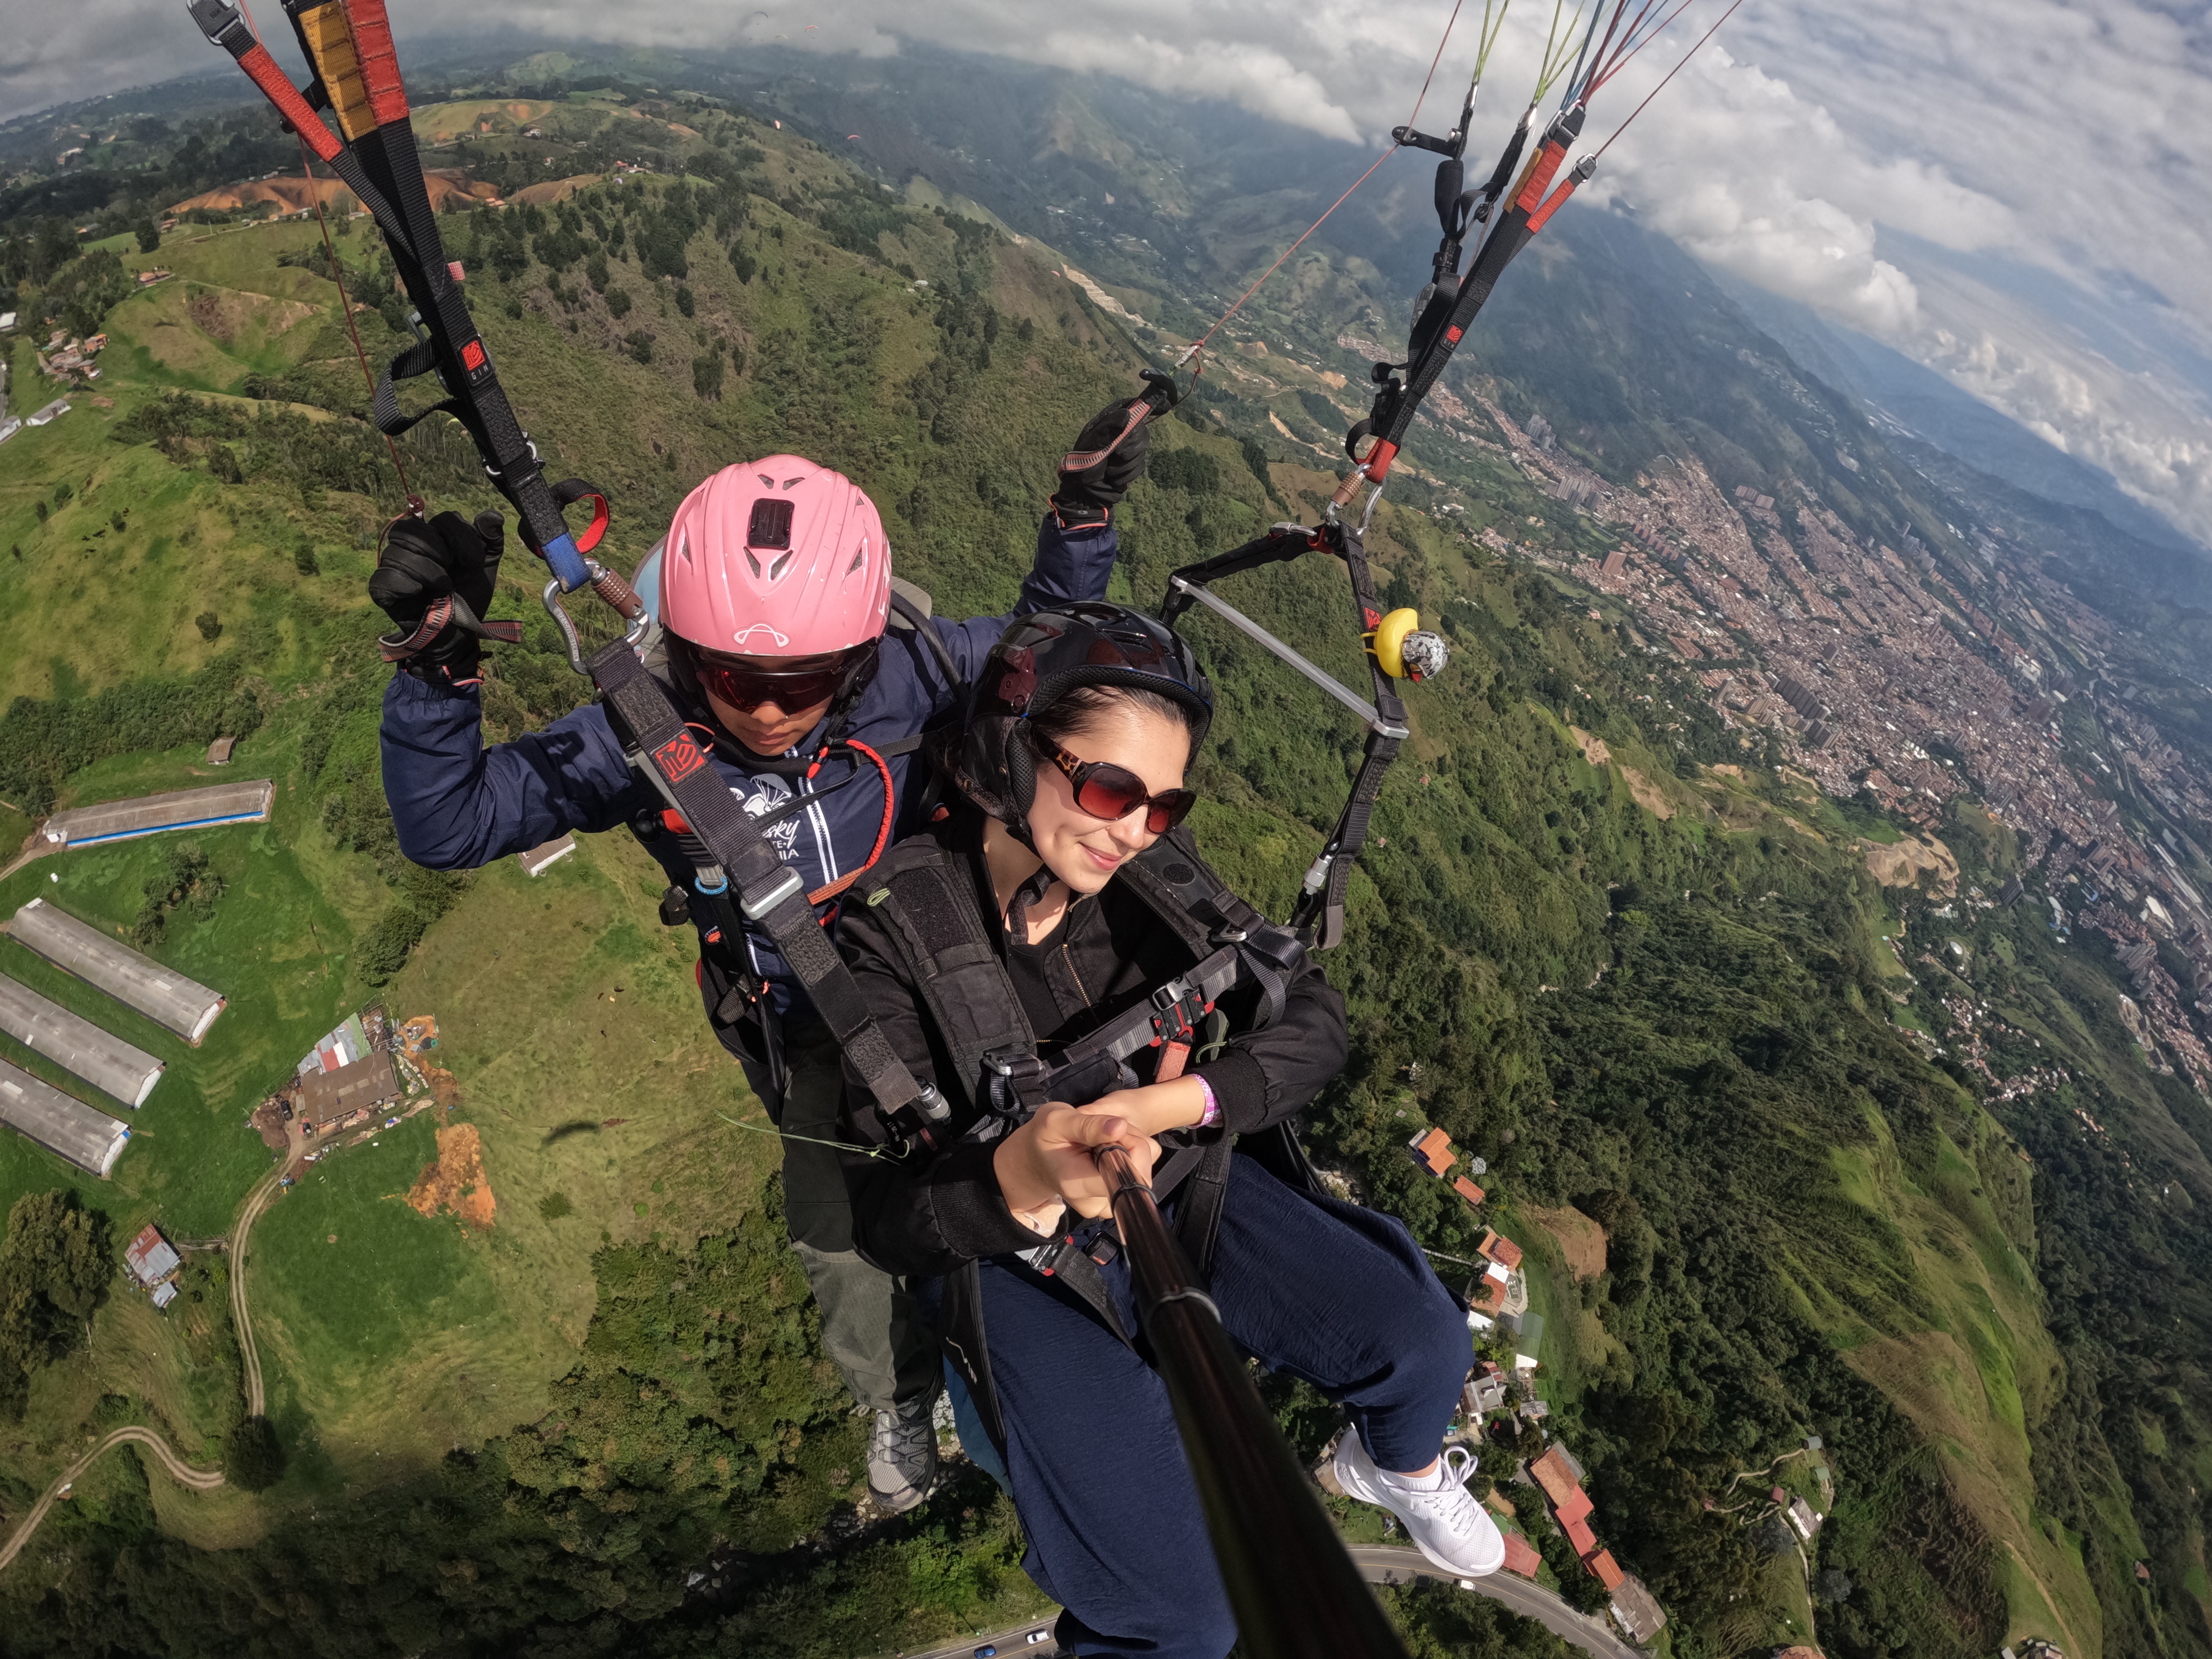
Paragliding in Medellín

Medellín, Colombia

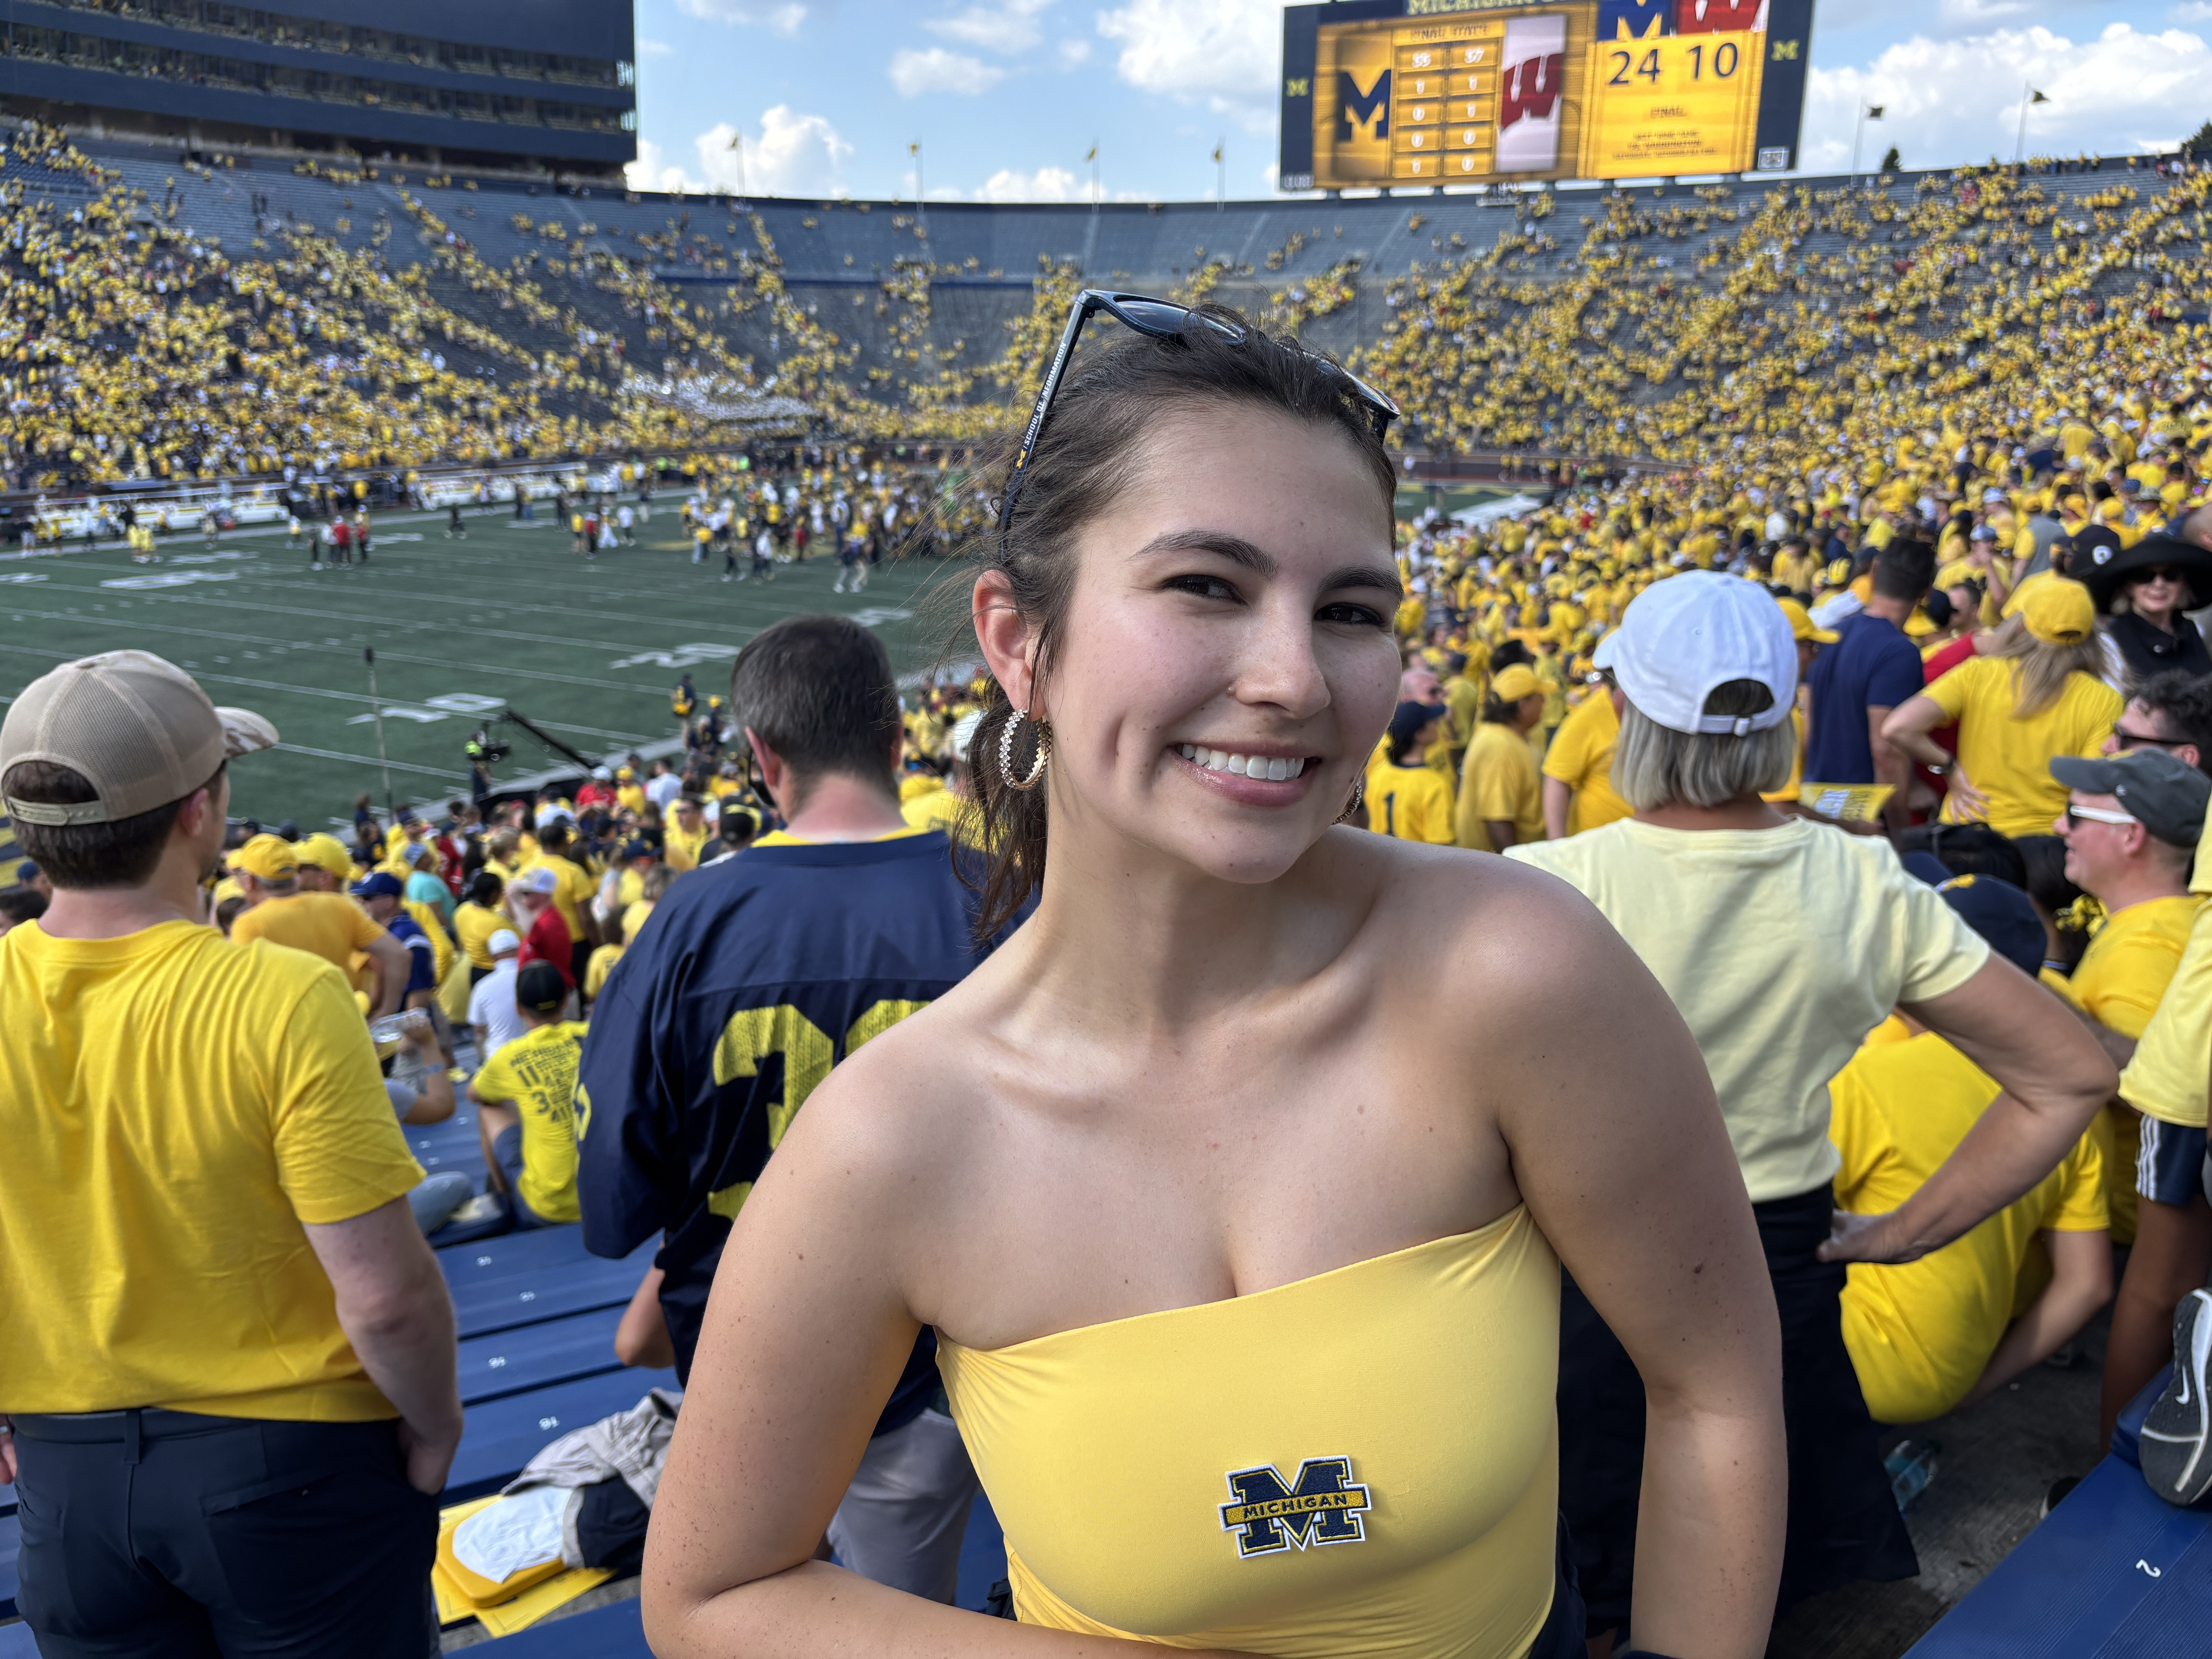
University of Michigan Big House

The Big House, UMich

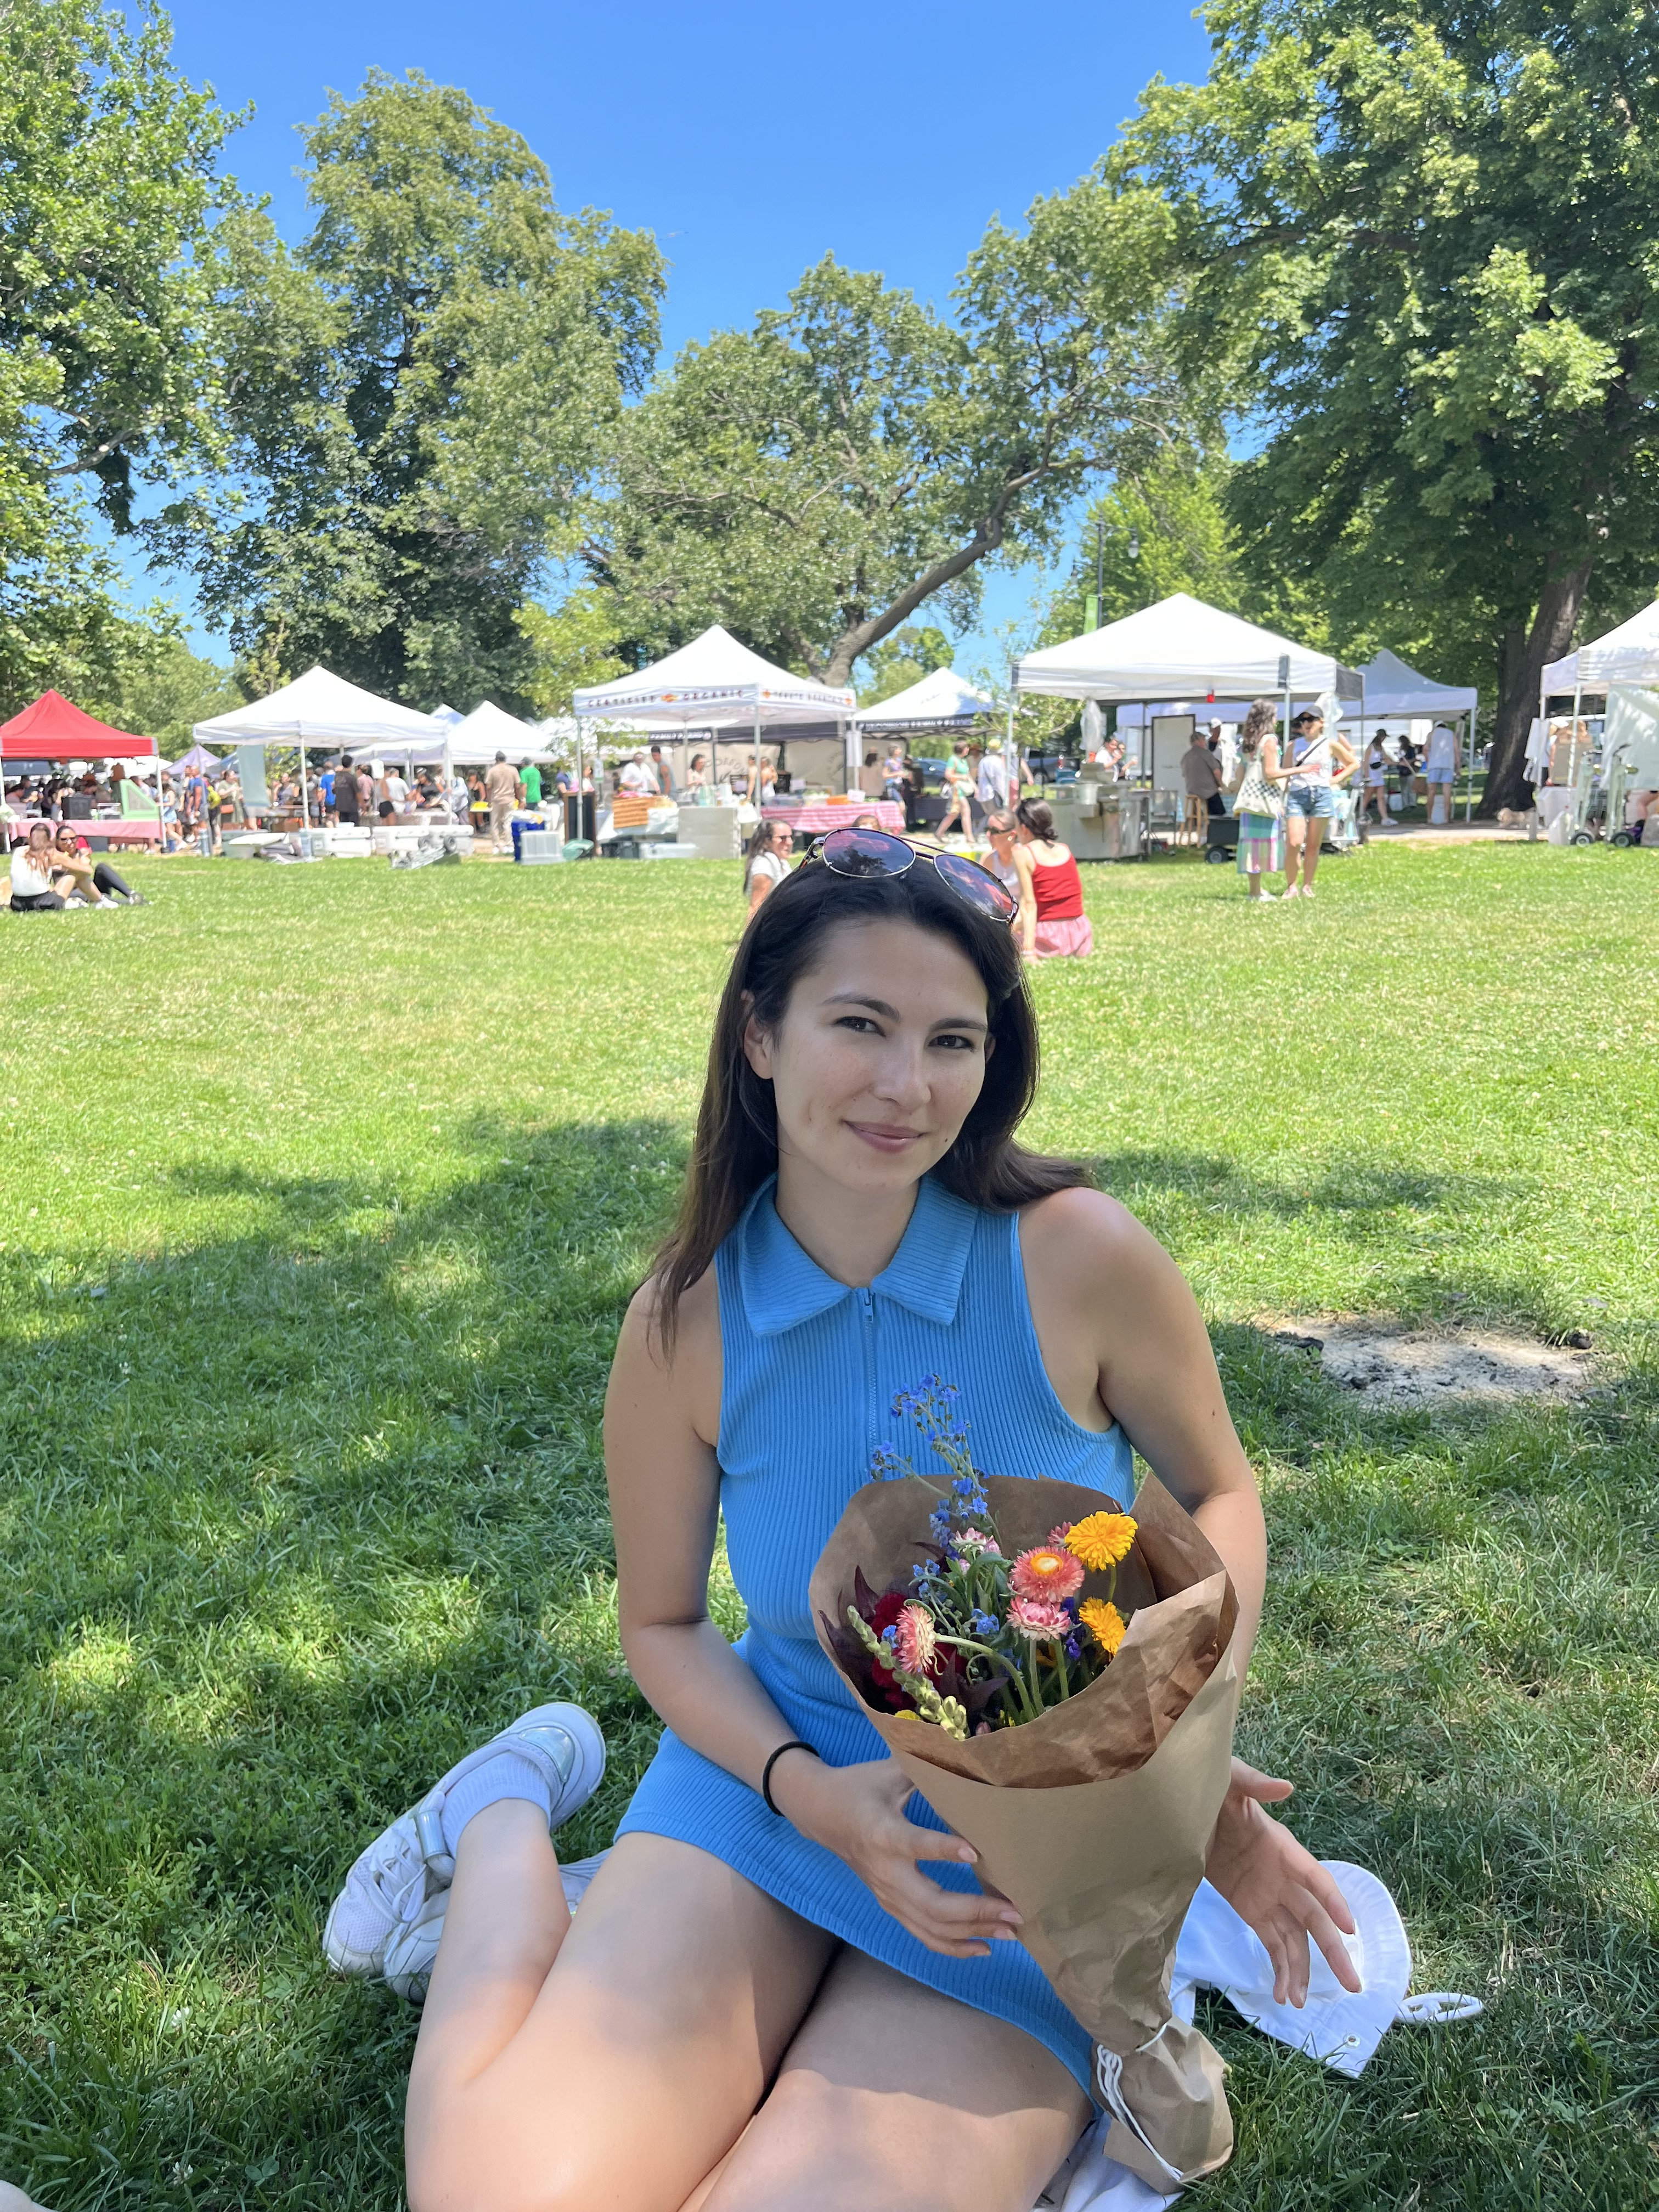
Lincoln Park Farmers Market

Lincoln Park Market, Chicago

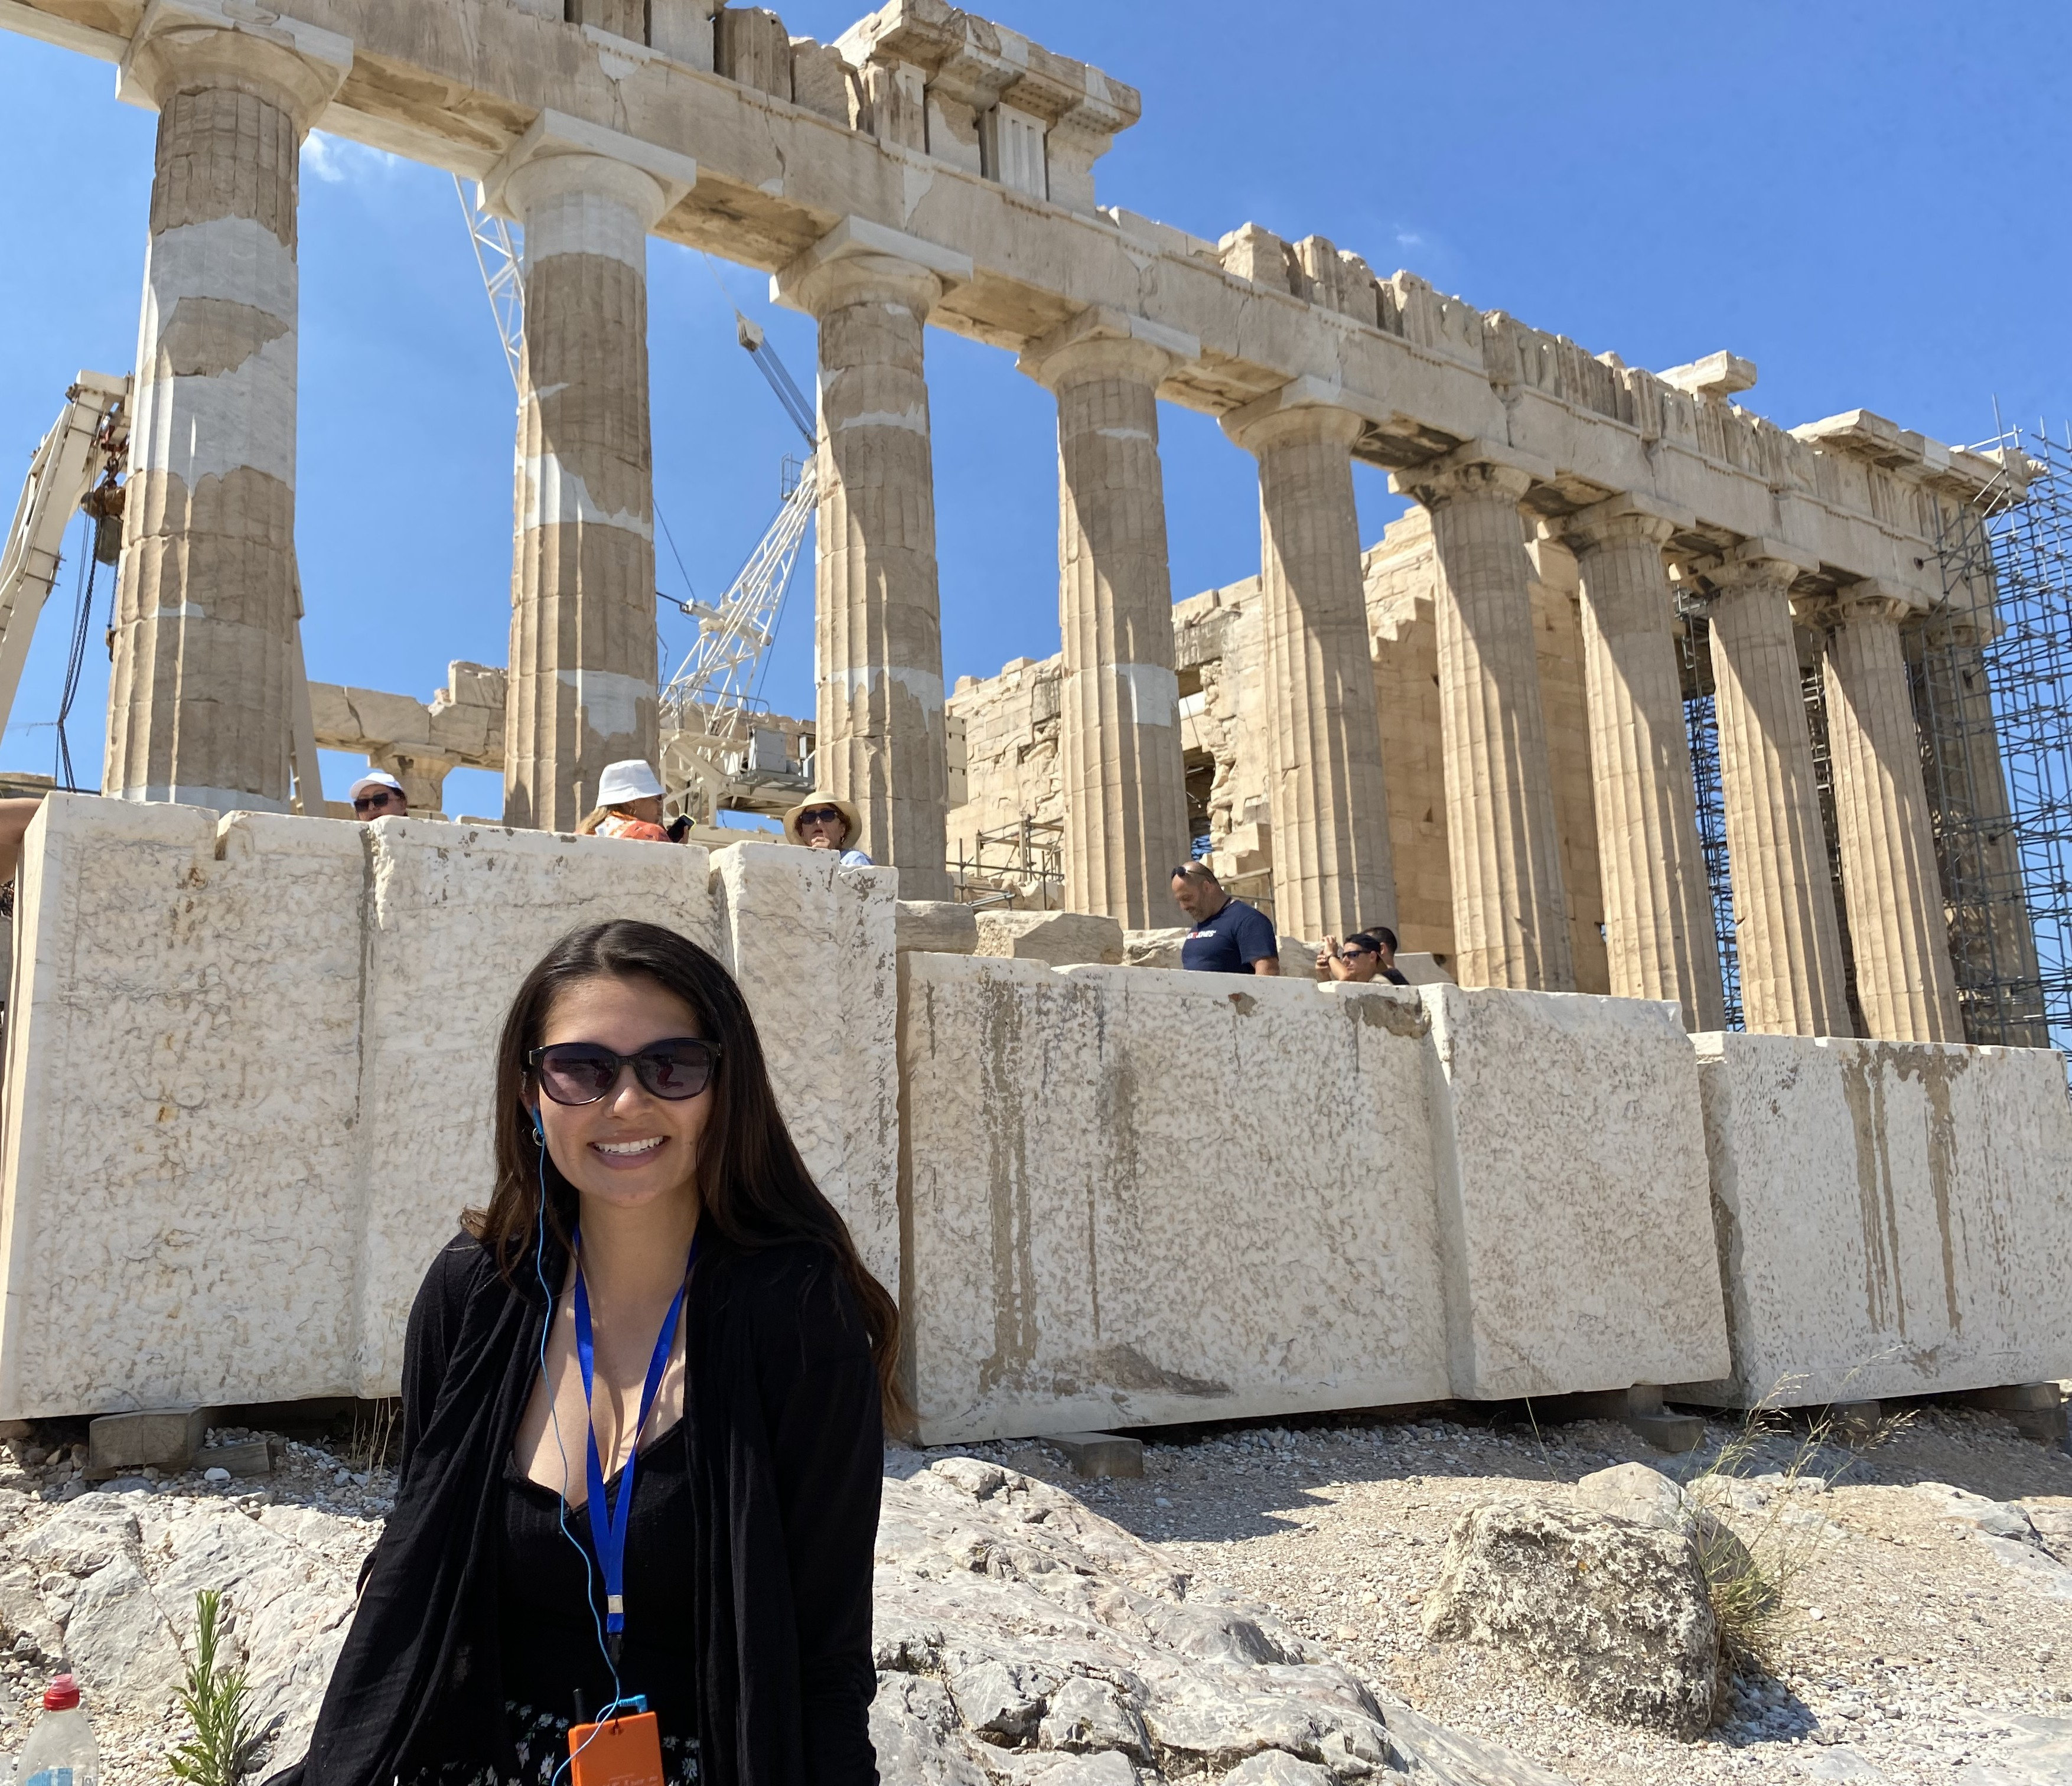
Acropolis of Athens

Acropolis of Athens

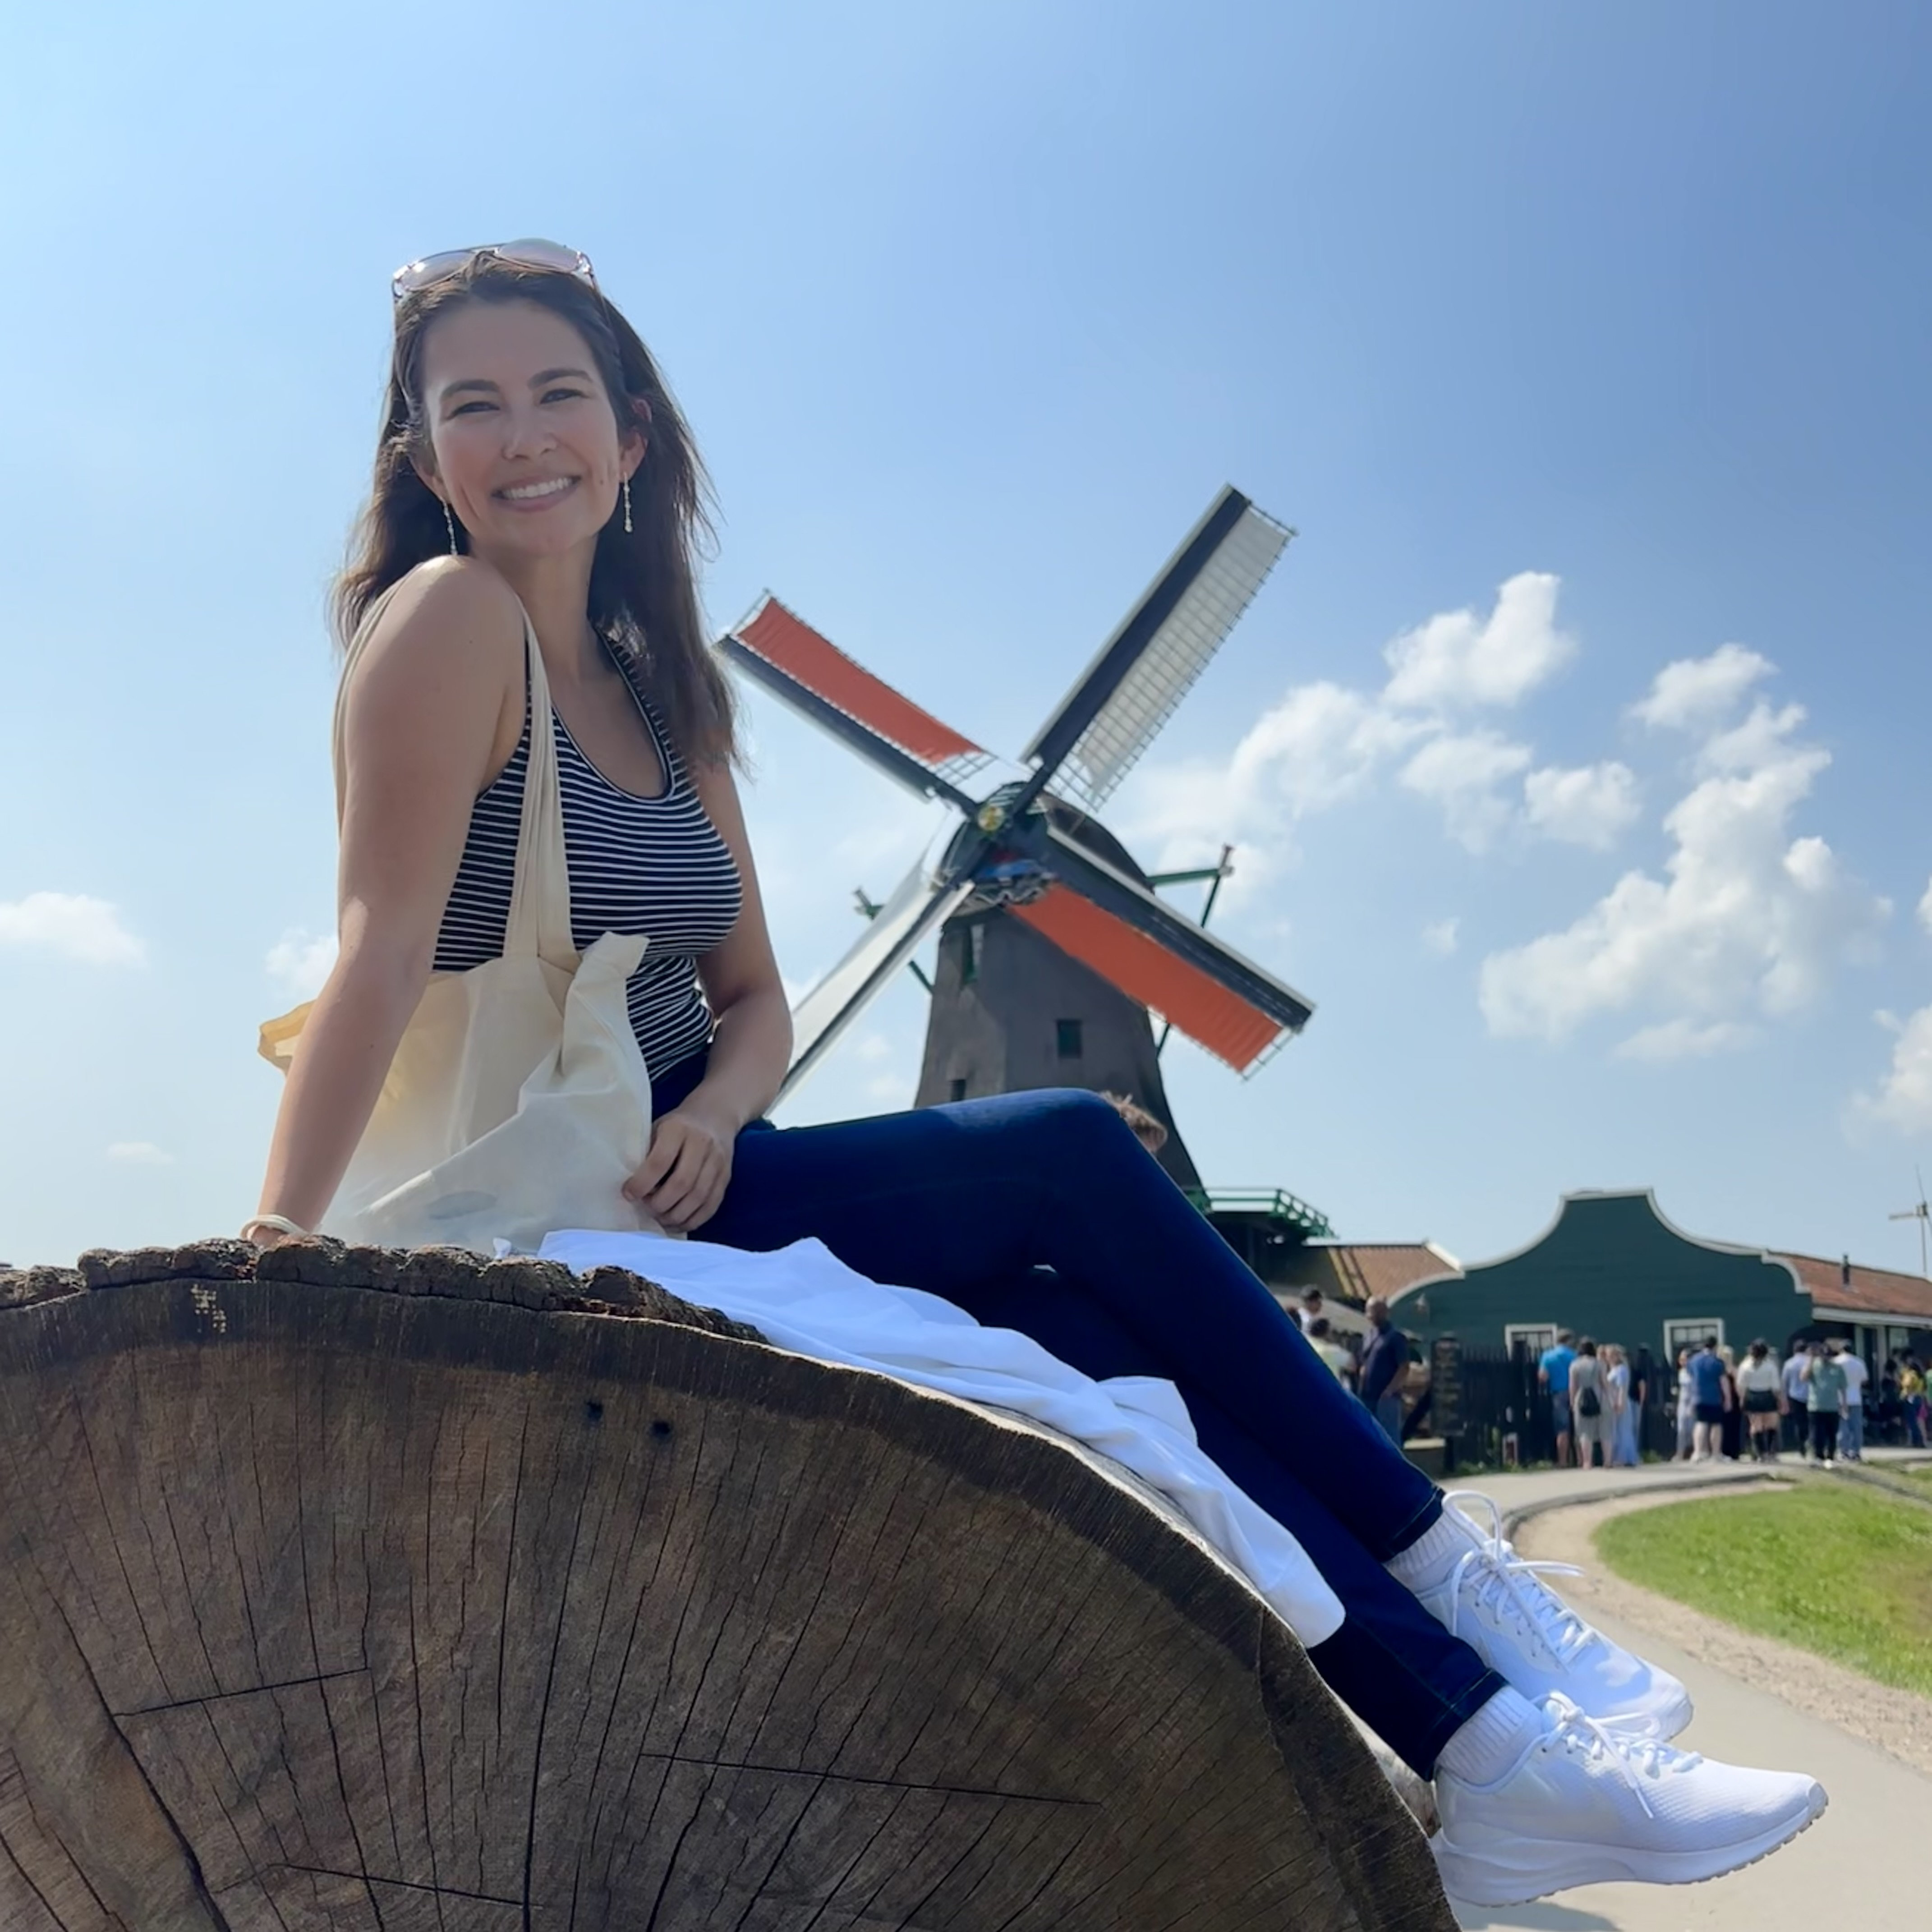
Zaanse Schans Windmills

Zaanse Schans, Netherlands

About Me

Building things, traveling everywhere.

Before I wrote code and performed statistical analyses for a living, I taught the concepts behind my work to teenagers. I spent four years as a high school math and AP Statistics educator, then went back to school myself, pairing an M.Ed. and B.A. in Mathematics with a Master of Applied Data Science at the University of Michigan (3.93 GPA). Today I work as a Data Scientist, building tools based on ideas I used to teach my students.

My toolkit runs from statistical modeling and machine learning (scikit-learn, XGBoost, PyTorch) to dashboards people actually want to open (Streamlit, Tableau, Power BI), plus a growing interest in retrieval-augmented generation and LLM tooling. I care about clean systems, honest documentation, and explanations that meet people where they are, which is a habit that started at a whiteboard.

Boarding pass — chapter 1

High School AP Statistics Educator

Aug 2022 — Jun 2026 · Von Steuben Metropolitan Science Center (CPS) · Chicago, IL

Four years teaching Algebra 1, Geometry, Algebra 2, and AP Statistics, plus coaching cross country.

Boarding pass — chapter 2

Data Scientist

Jun 2026 — Present · RCM Alternatives · Chicago, IL

Building automated SQL and Python pipelines that cut manual contract classification time by over 90%, and shipping Streamlit dashboards that give leadership a clear read on the contract categories.

4

years teaching in the classroom

3.93

GPA, U-M data science

Python

+ SQL, daily drivers

1

carry-on

Academic Background

Education

Marist Logo Watermark
Marist College Graduation

Bachelor's Degree

Class of 2020

Marist University

Mathematics

Foundation in rigorous mathematics, analytics, and core disciplinary studies. Graduated cum laude.

DePaul Logo Watermark
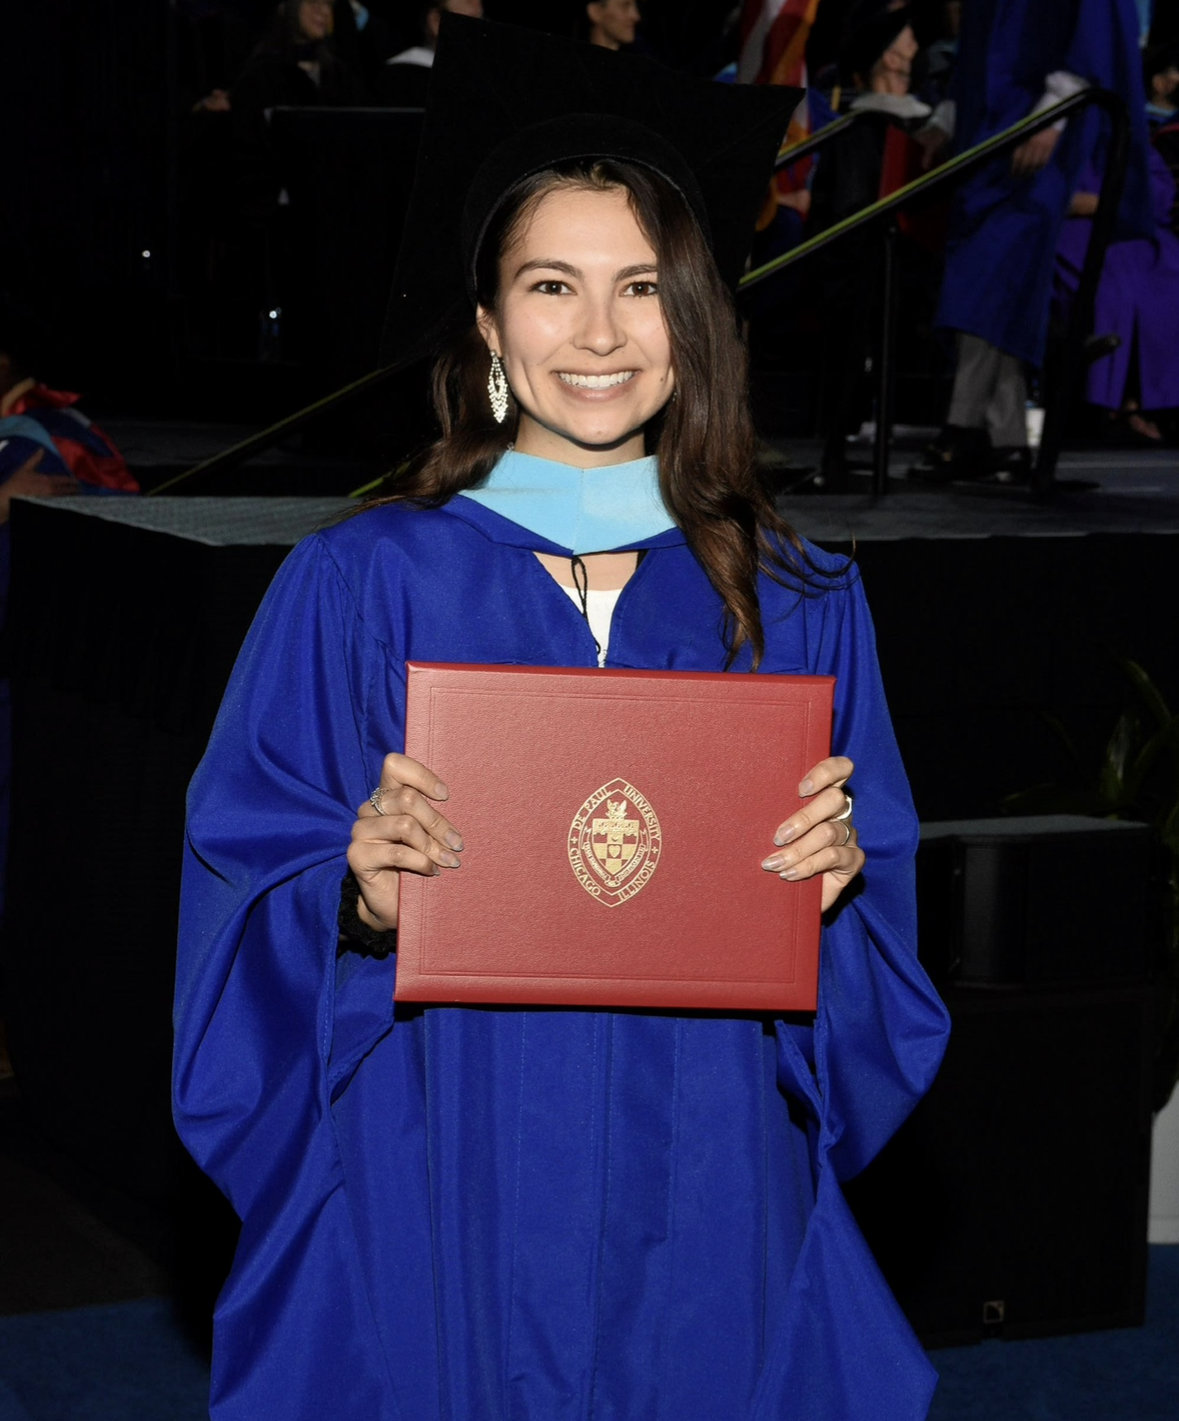
DePaul University Graduation

M.Ed (Master of Education)

Class of 2022

DePaul University

Mathematics

Honed instructional intuition and methods for making complex topics click.

Michigan Logo Watermark
Coming Soon University of Michigan

MADS (Master of Applied Data Science)

Class of 2026

University of Michigan

Applied Data Science

Advanced computational data science, machine learning, and scalable systems.

Expertise & Stack

Resume Skills

Python
SQL
HTML
Pandas & NumPy
Scikit-learn & PyTorch
Regression & XGBoost
Machine Learning
Statistical Modeling
Hypothesis Testing
Streamlit & Tableau
Data Visualization
LangChain & RAG
Git & VS Code
Mathematics
Curriculum Design
Data Analysis

four years of ap statistics, rebuilt for the web

Statistical Modeling Lab

A few of the interactive tools I leaned on constantly in the classroom. Reshape a Normal curve or a Chi-Square curve with a drag of a slider, or use the built-in Z-score and probability calculator to find P(Z ≤ z) below, above, or between any two values instantly. Built with Streamlit and Plotly, embedded live below.

statisticalmodelinglab.streamlit.app
normal distribution chi-square distribution z-score & probability calculator LaTeX formulas
Open full lab

live from the globe

Travel Journal

A 3D interactive globe tracking every trip, stop, and route: flights as solid arcs, trains dashed, buses dotted, ferries as waves. Spin it, click a marker, and it pulls up the story behind that stop. Scoll down to see trip analytics. Built with Streamlit, embedded live below.

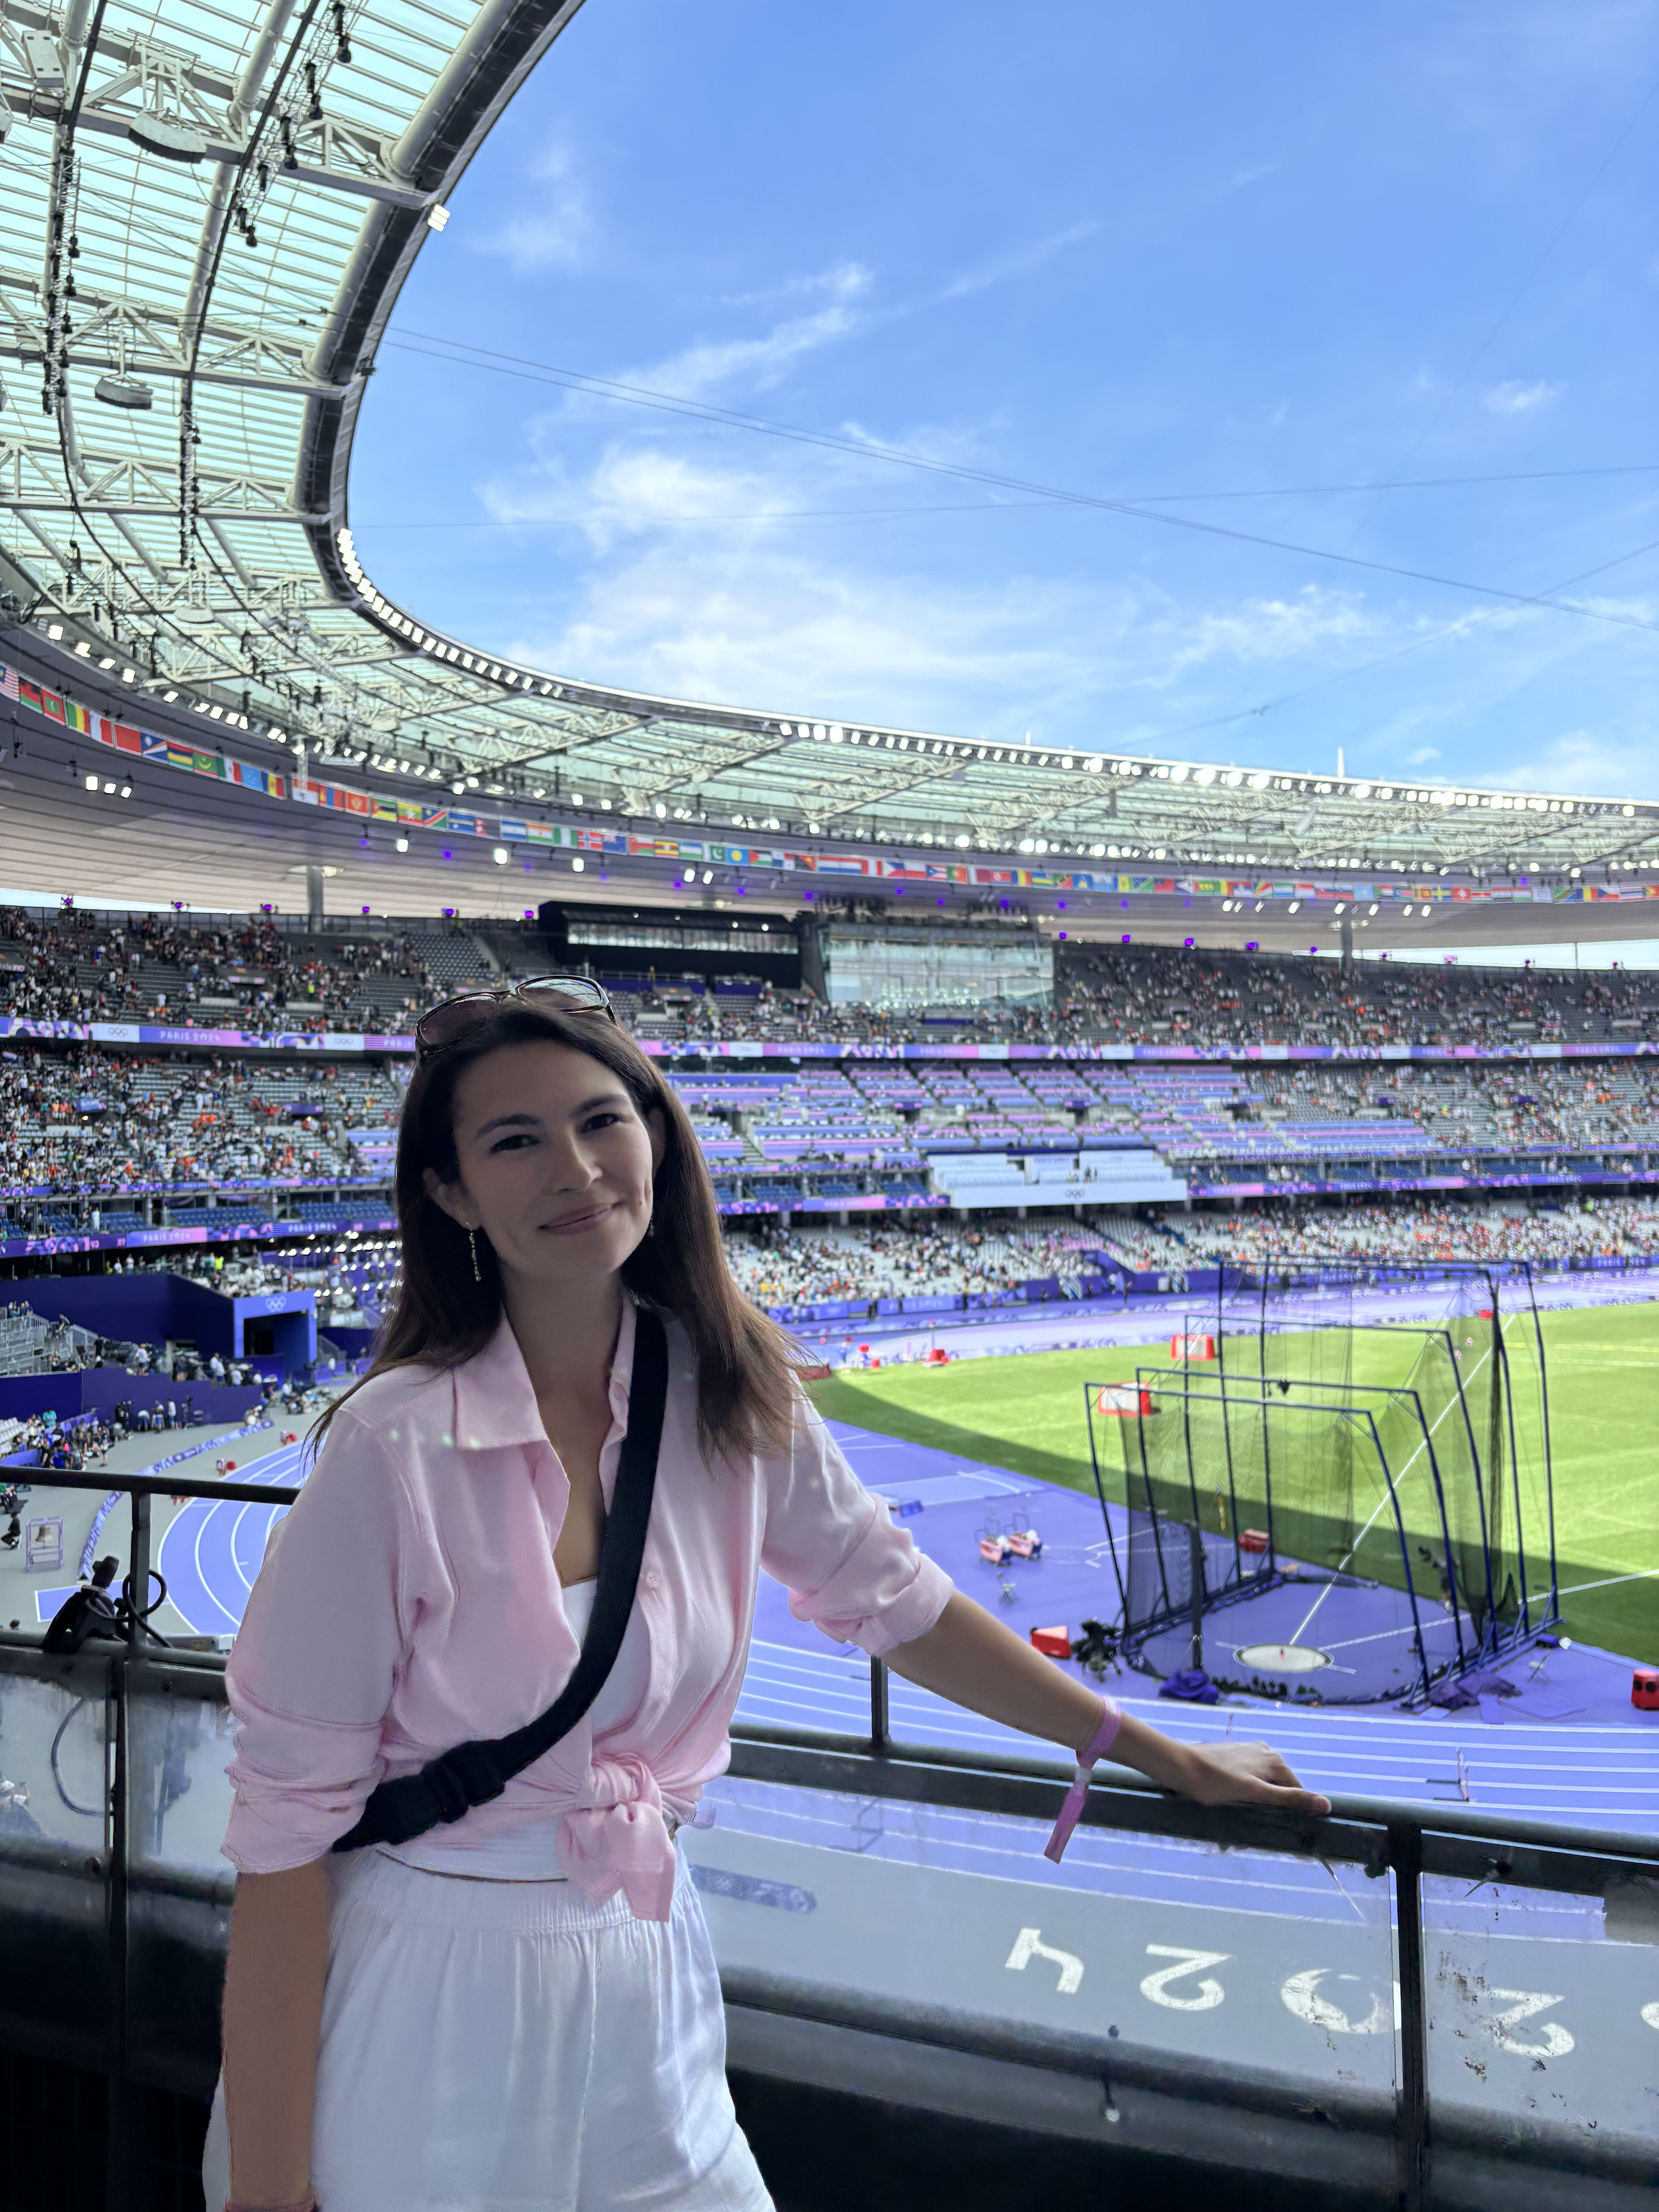
Paris Olympics

Paris, France
Summer Olympics '24

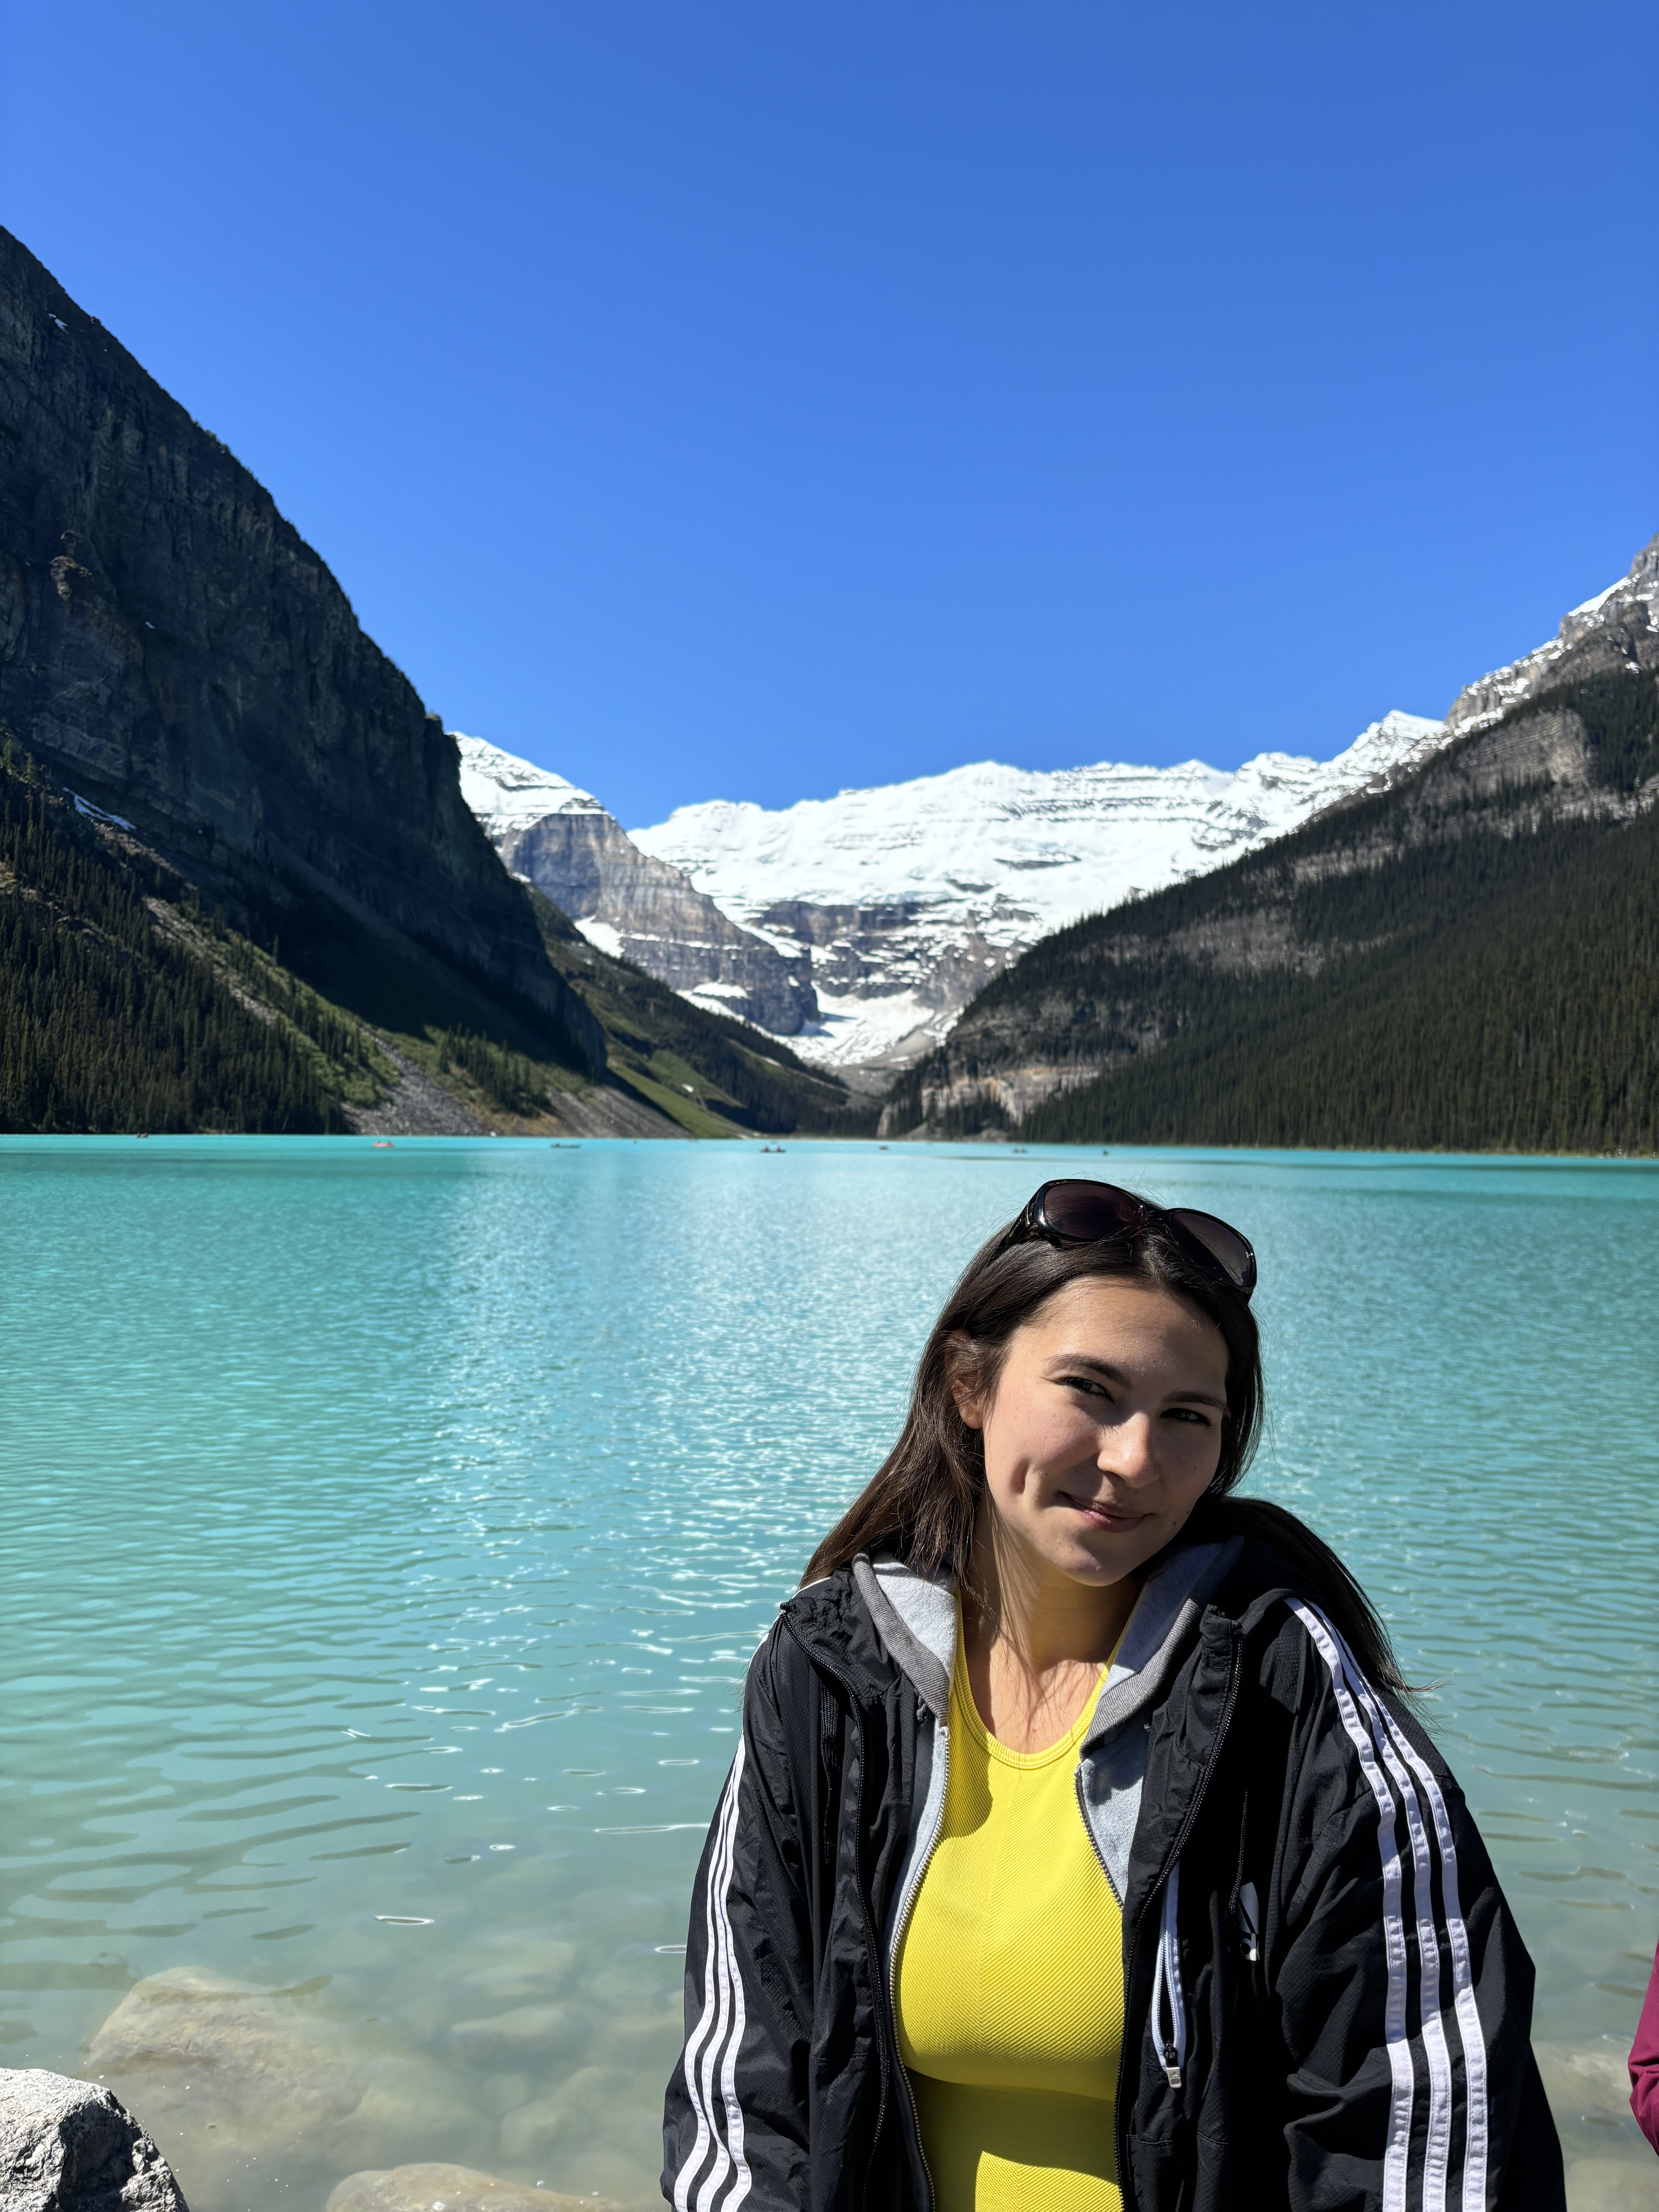
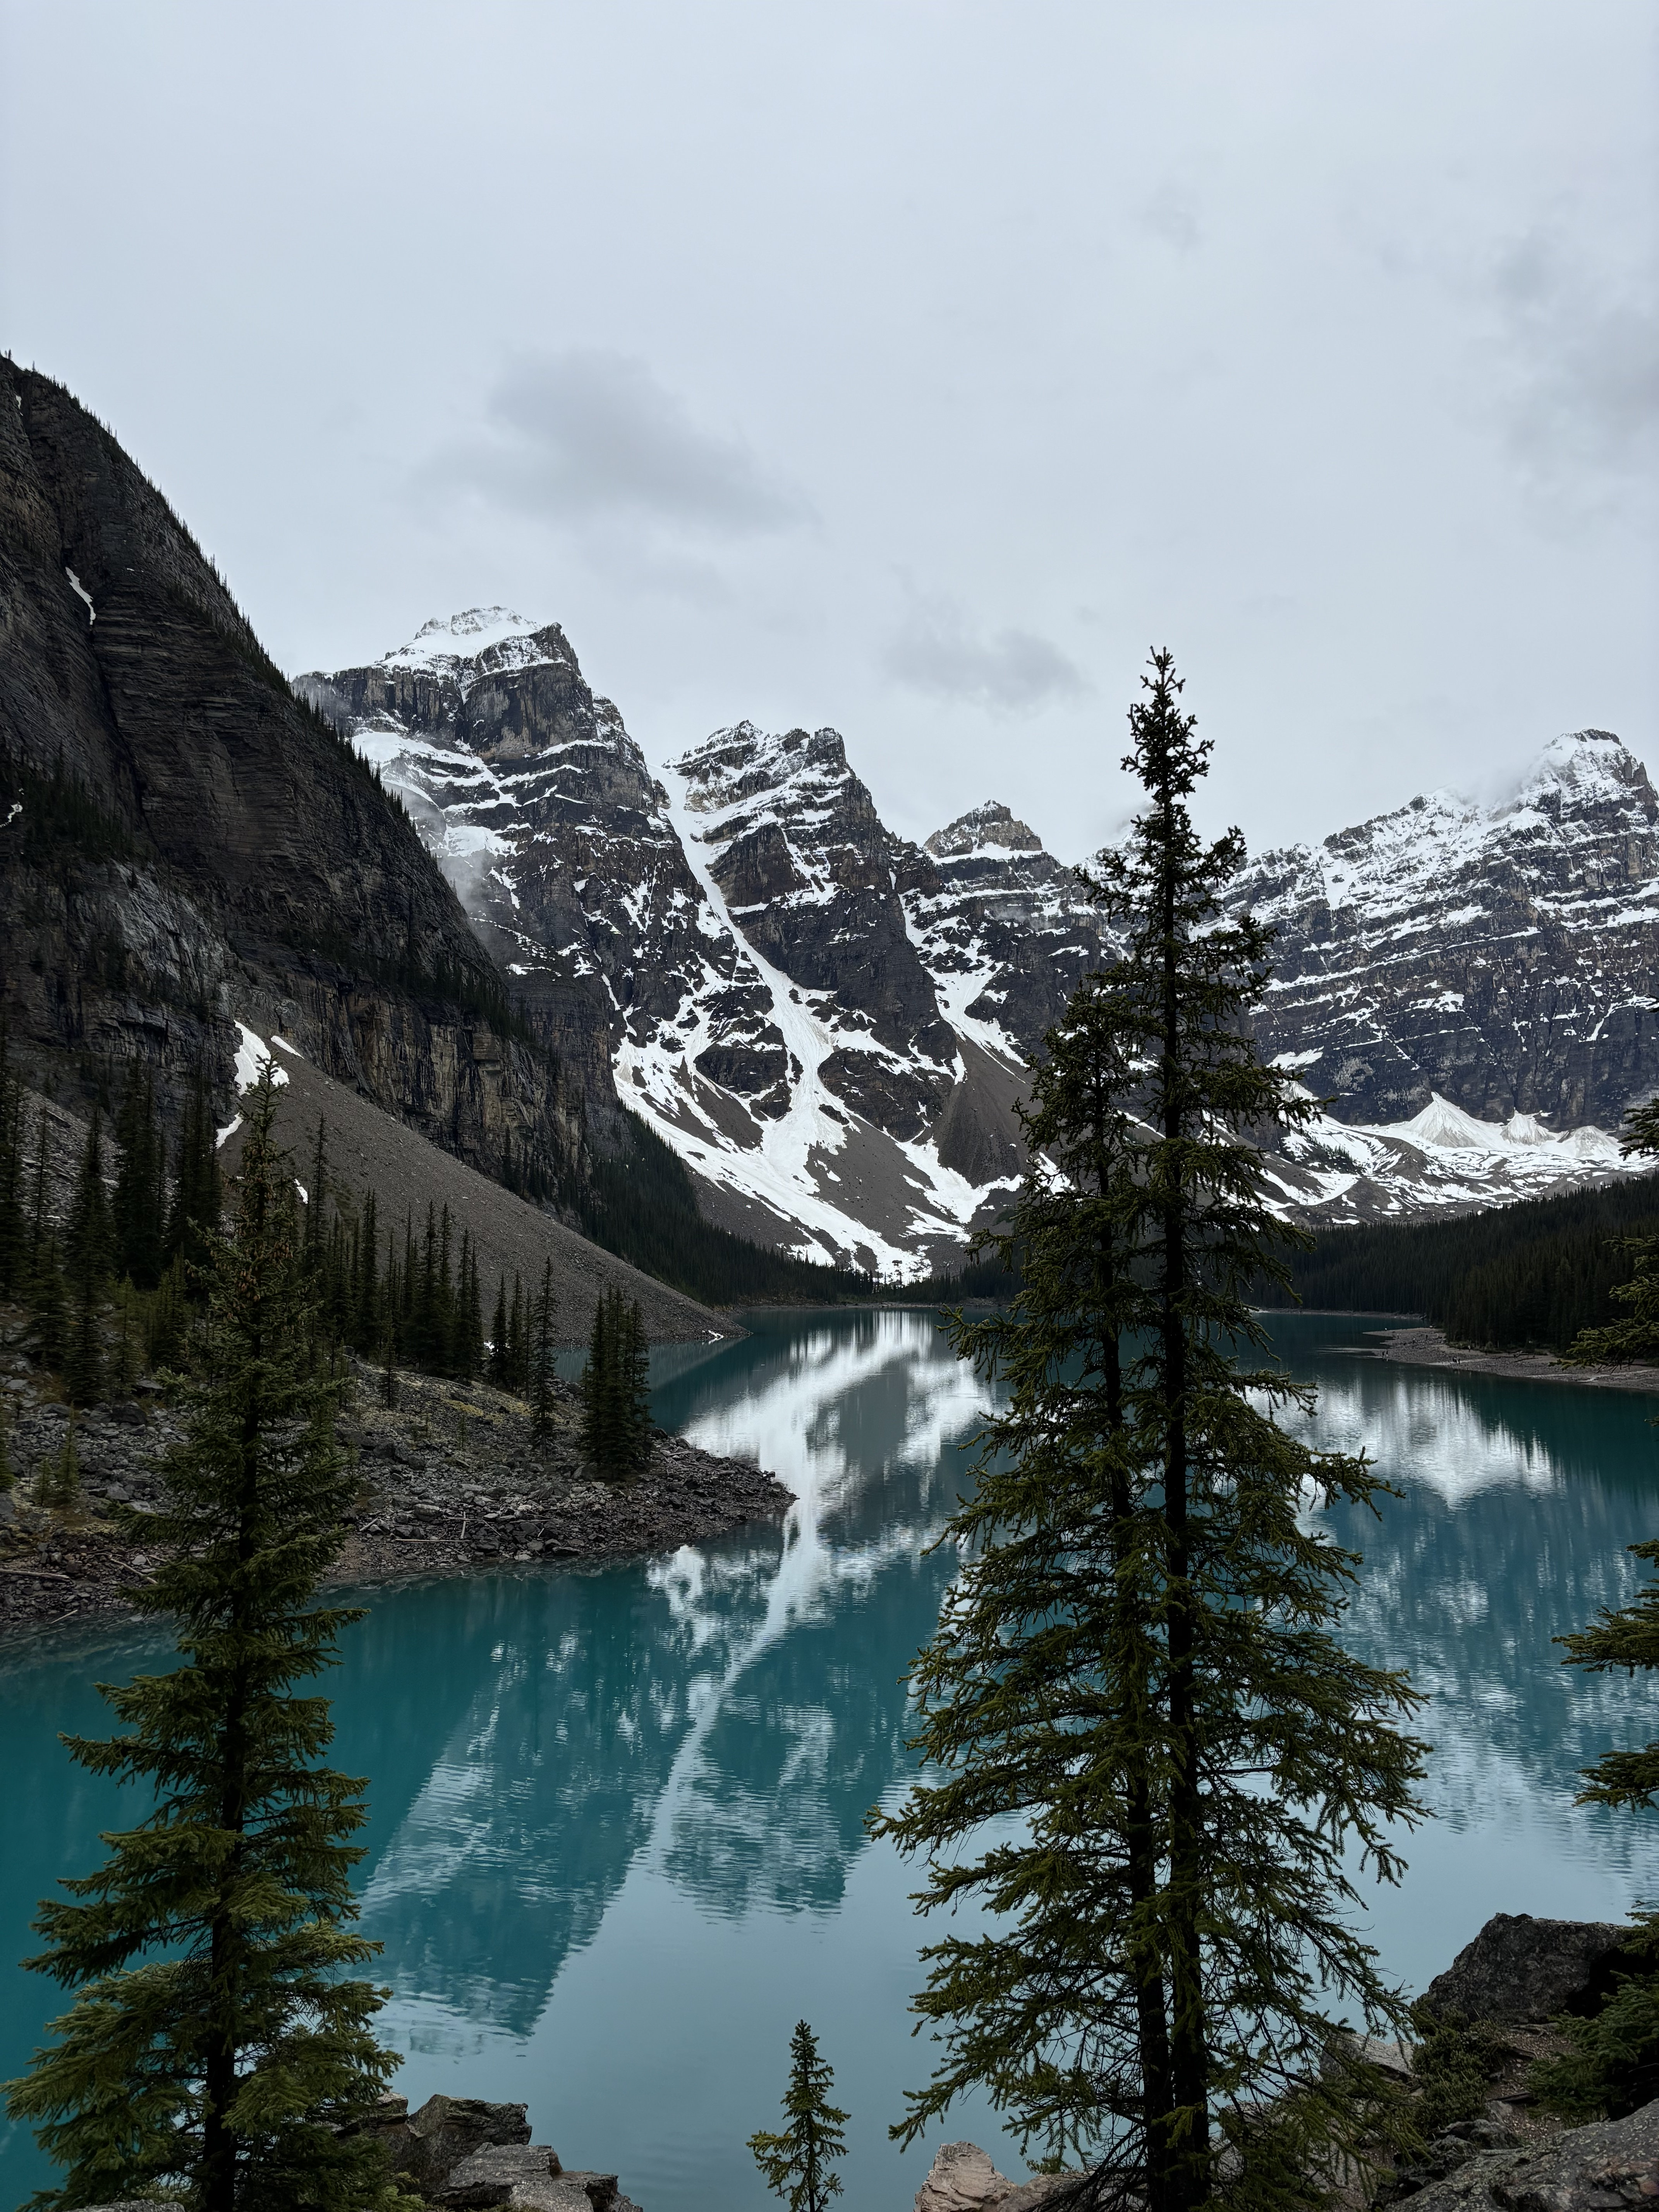
Lake Louise, Banff

Banff, Canada
Lake Louise

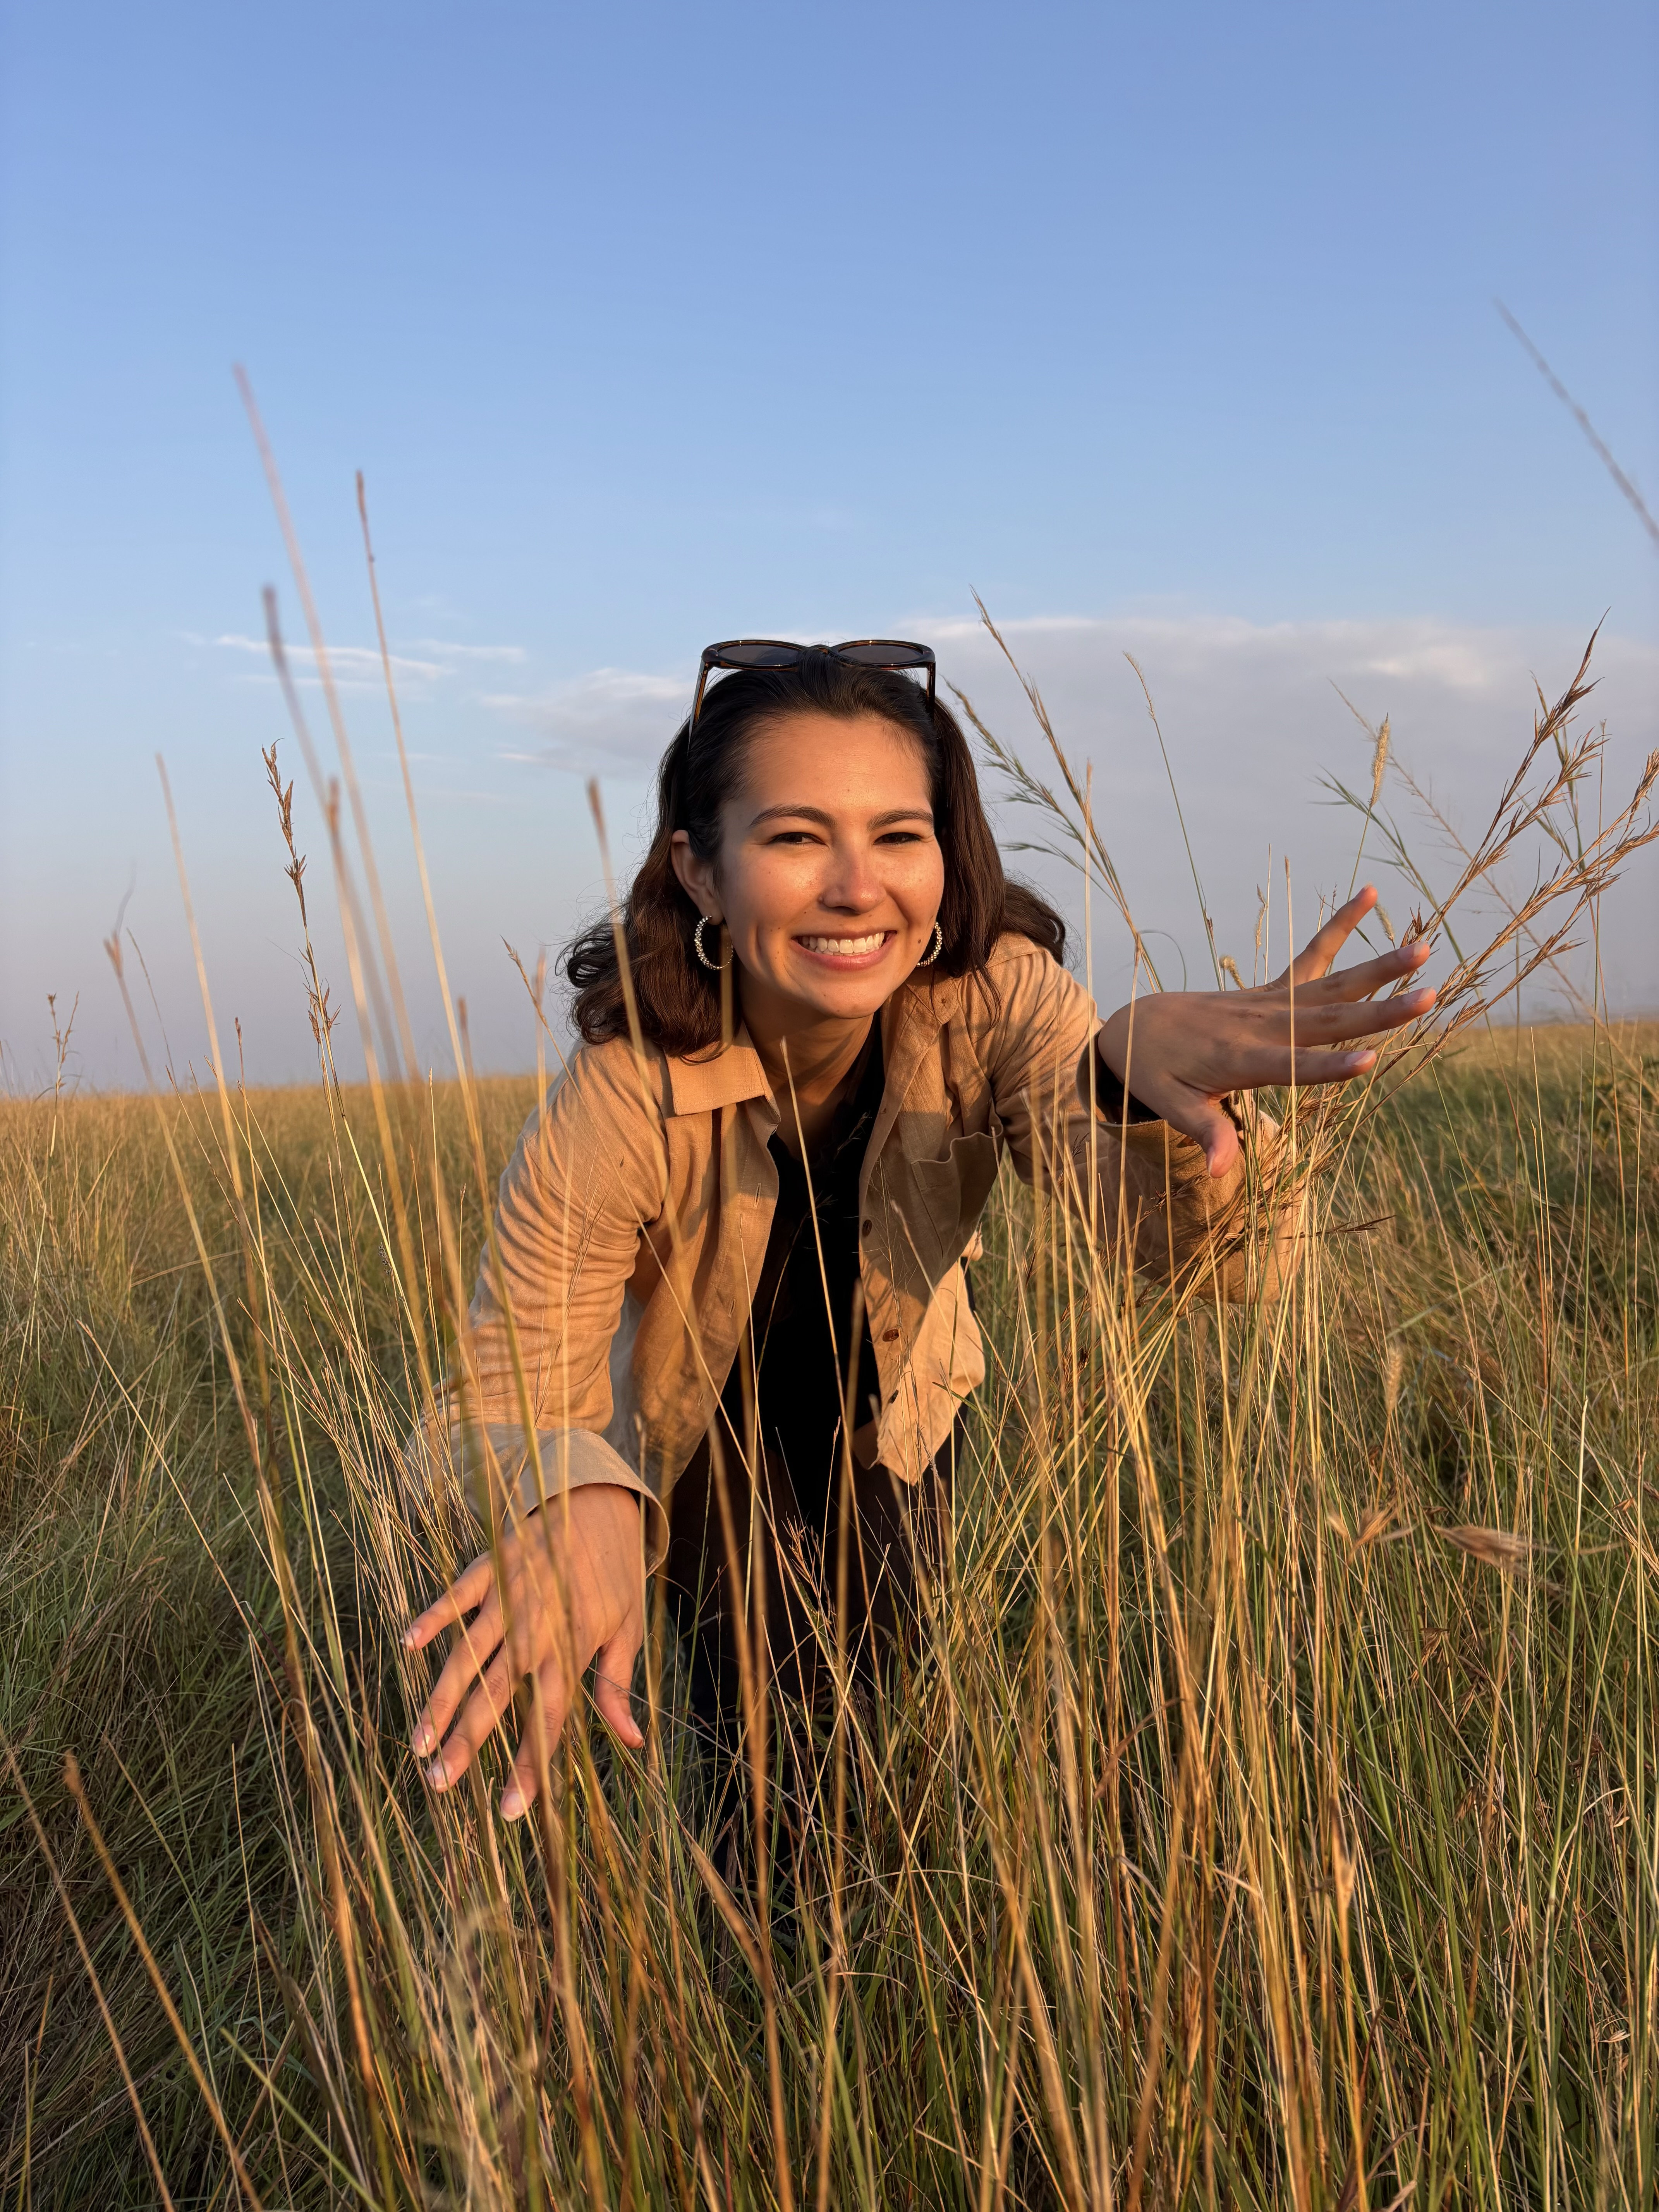
Safari in Kenya

Kenya
Safari

interact-map-sophia.streamlit.app
flight train bus ~ ferry
Open full journal

field notes

22 countries, more booked.

Every stop on the globe above, grouped by continent. Africa and Asia are next on the calendar ~ South Africa, Zimbabwe, Botswana, Madagascar, and Thailand are up ahead.

22

countries visited, 5 continents

visited next up hover a country for its name

North & South America — 4

USA Mexico Canada Colombia

Europe — 15

UK Ireland Iceland Norway Sweden Denmark Netherlands Belgium Luxembourg France Germany Italy Vatican City Monaco Greece

Africa — 1

Kenya

Oceania — 2

Australia New Zealand

Asia — 0

None yet

— next up, upcoming global expansion

South Africa Zimbabwe Botswana Mauritius Madagascar Thailand

geomagnetic forecast

Real-Time Aurora Forecast & Geomagnetic Nowcasting

Developed a real-time space weather forecasting tool using Python, Streamlit, and Cartopy that predicts geomagnetic storm intensity and dynamically maps the auroral oval. Trained and evaluated linear regression, Lasso, and LSTM models on nearly 20 years of NASA OMNIWeb solar wind data (~14 million rows), engineering 76 time-lagged features to forecast the Kp index across multiple horizons. The resulting lightweight Lasso model runs end-to-end in 0.6 seconds and achieves a test MAE of 0.58. The interactive web application integrates live NOAA feeds to render location-specific visibility probabilities and asymmetric auroral boundaries driven by spherical trigonometry and solar orientation shifts.

aurora-visualizer-app.streamlit.app
Kp index model NOAA/OMNI data live oval mapping
Open full forecast